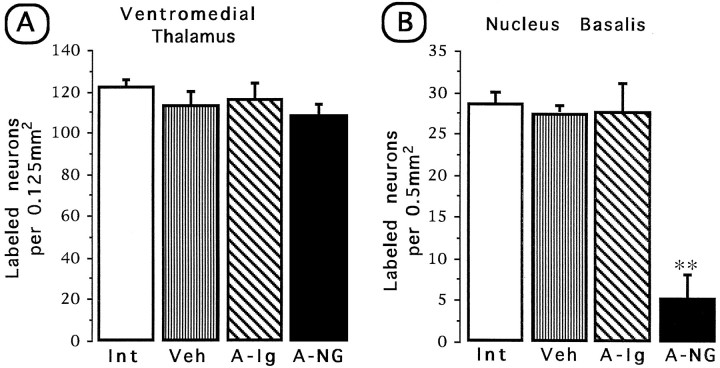
Fig. 5.
Quantitative FG retrograde tracing of thalamic cells projecting to the IC (A) and forebrain cells projecting to the IC (B) in the anti-NGF-treated side and the contralateral vehicle-treated side. Int, Intact control; Veh, vehicle; A-Ig, anti-IgG;A-NG, anti-NGF. Comparisons were made against the intact control group. **p < 0.01.

