
Fig. 2.
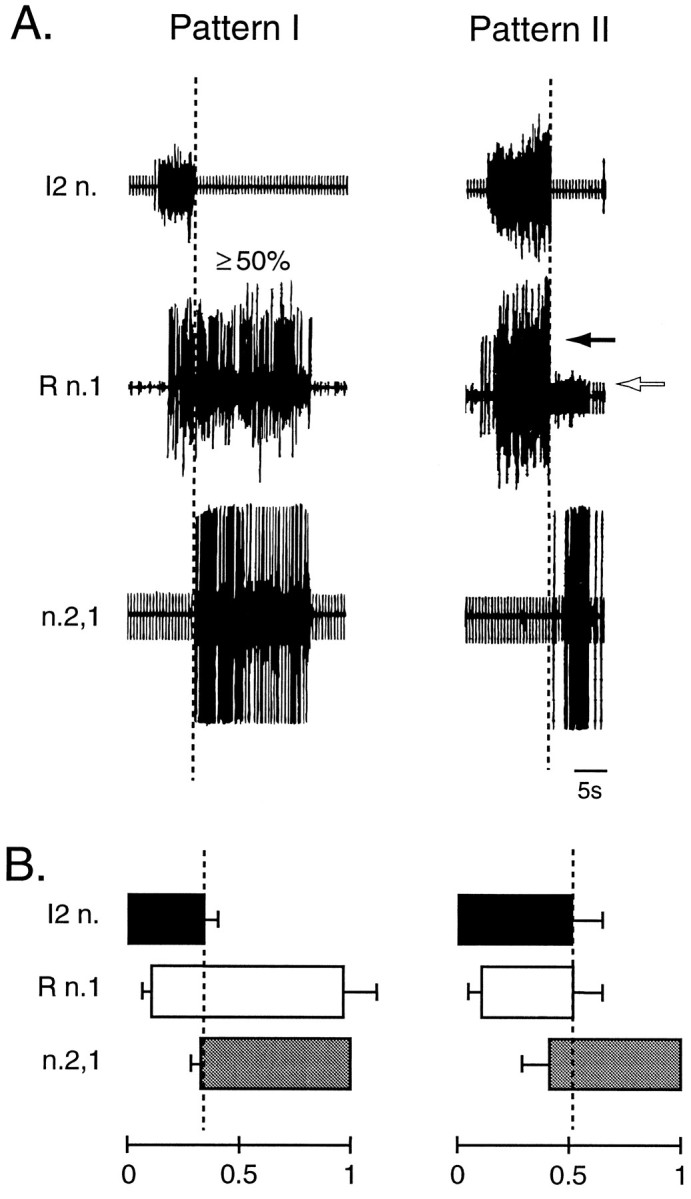
Both patterns I and II were elicited by tonic stimulation of n.2,3. A, In both patterns I and II, a burst of spikes in I2 n. preceded a burst of spikes in n.2,1. Pattern I was defined as one in which 50% or more of the large-amplitude activity in the R n.1 occurred after the end of the I2 n. burst (dashed line). In pattern II, large-amplitude activity in R n.1 (black arrow), which can be distinguished from small-amplitude activity (white arrow), does not extend beyond the burst in I2 n. (dashed line). These examples of pattern I and II were recorded from the same preparation. An artifact of the tonic stimulation of n.2,3 appears in I2 n. and n.2,1 traces. B, The average phase relationship of activity in I2 n. (black), n.2,1 (gray), and the large-amplitude R n.1 activity (white) in pattern I (n = 46) and pattern II (n = 8) recorded during the test period in the 10 nondesheathed control preparations (see Fig. 4). The key distinguishing feature of patterns I and II was the duration of large-amplitude activity in R n.1 that extended beyond the termination of the I2 n. phase. In this and subsequent figures, the bars indicate the mean values ± SEM.