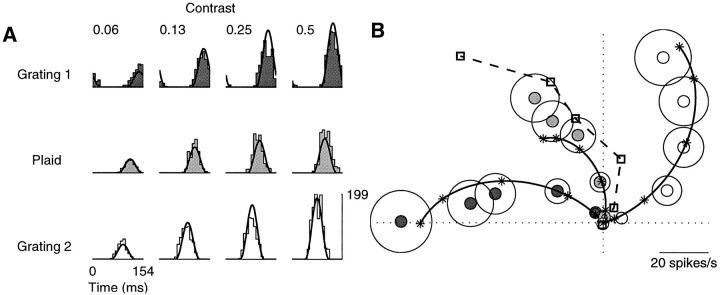
Fig. 11.
Responses to the sum of two equally effective stimuli. Components differed in spatial frequency. Continuous curves are fits of the normalization model. A, Period histograms for four different contrasts. Dark gray, Responses to grating 1 (1.2 cycles/degree). White, Responses to grating 2 (0.6 cycles/degree). Light gray, Responses to the sums of the stimuli in the top and bottom rows. B, Polar plot of the first harmonic responses.Squares indicate the vectorial sums of the responses to the individual gratings (dark gray and white data points). The actual responses to the plaid were smaller (closer to the origin) and occurred slightly sooner (counterclockwise) than this linear prediction. Cell 385r037 (DI = 0.9; SF = 0.8; SZ = 1.7), experiment 05; N = 4. Parameters: τ0 = 45 msec; τ1 = 2 msec;n = 2.44.

