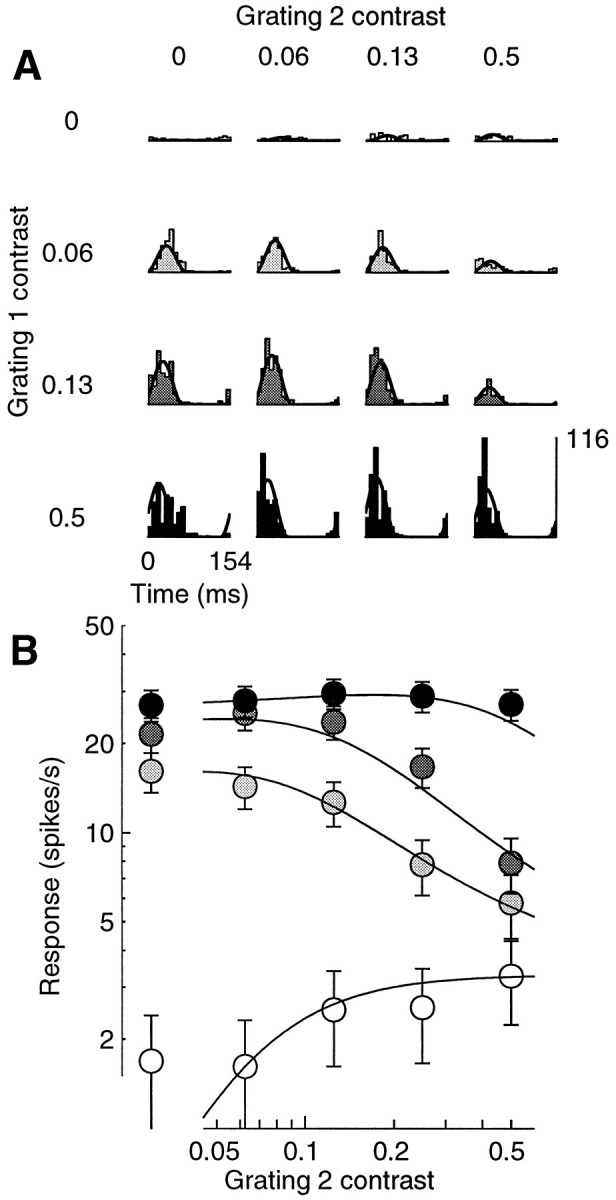
Fig. 12.

Masking with a grating that is effective in driving the cell. Responses to a plaid experiment in which one component was nearly optimally oriented (grating 1), and the other was orthogonal but still elicited some response when presented alone (grating 2). A, Period histograms for different contrasts of the components. Rows, Different contrasts of grating 1 (c1) .Columns, Different contrasts of grating 2 (c2) . When presented alone, grating 1 elicited strong responses (left column), grating 2 weak responses (top row). B, Response amplitude as a function of c2, for different values of c1 (white to black: 0, 0.06, 0.12, and 0.5). Increasing c2 increased the size of the responses when grating 1 was absent; it inhibited the responses for intermediate contrasts of grating 1, and it had little effect for high contrasts of grating 1. Cell 392r013 (DI = 0.9; SF = 0.4; SZ = 3.4), experiment 12; N = 3. Parameters: τ0 = 136 msec; τ1 = 1.4 msec;n = 2.22.
