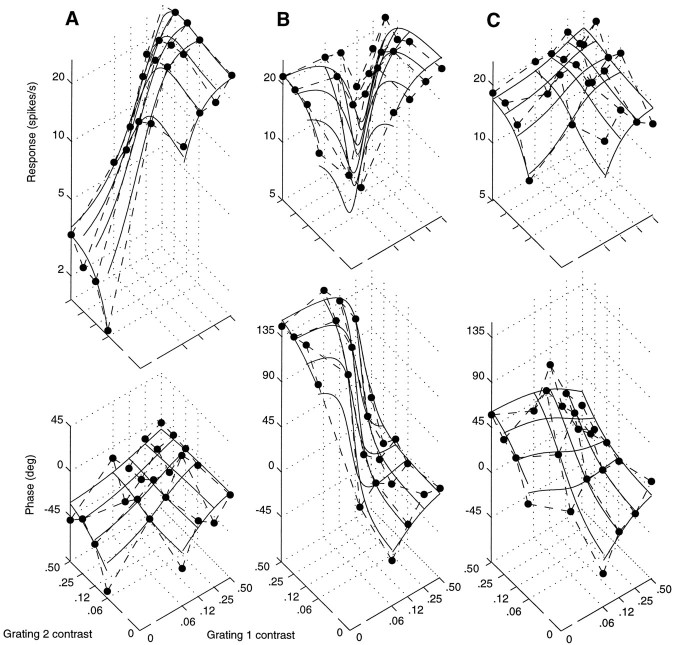
Fig. 13.
Amplitude (top) and phase (bottom) of the responses of a cell to three different plaids, for different contrasts c1 and c2 of the two components. Circlesconnected by dashed lines are actual responses;continuous curves are fits of the normalization model. Grating 1 was the same in all three experiments. Its orientation was close to optimal. A, Grating 2 was orthogonal to grating 1.B, Grating 2 drifted 30° away from grating 1.C, Same as B, but phase of grating 2 was delayed by 90°. Cell 392r013 (same as Fig. 12), experiments 12, 9, and 8. Parameters: A, τ0 = 40 msec; τ1= 1.3 msec; n = 2.1; B, τ0 = 35 msec; τ1 = 1.4 msec; n = 1;C, τ0 = 52 msec; τ1 = 1.7 msec;n = 1.1.

