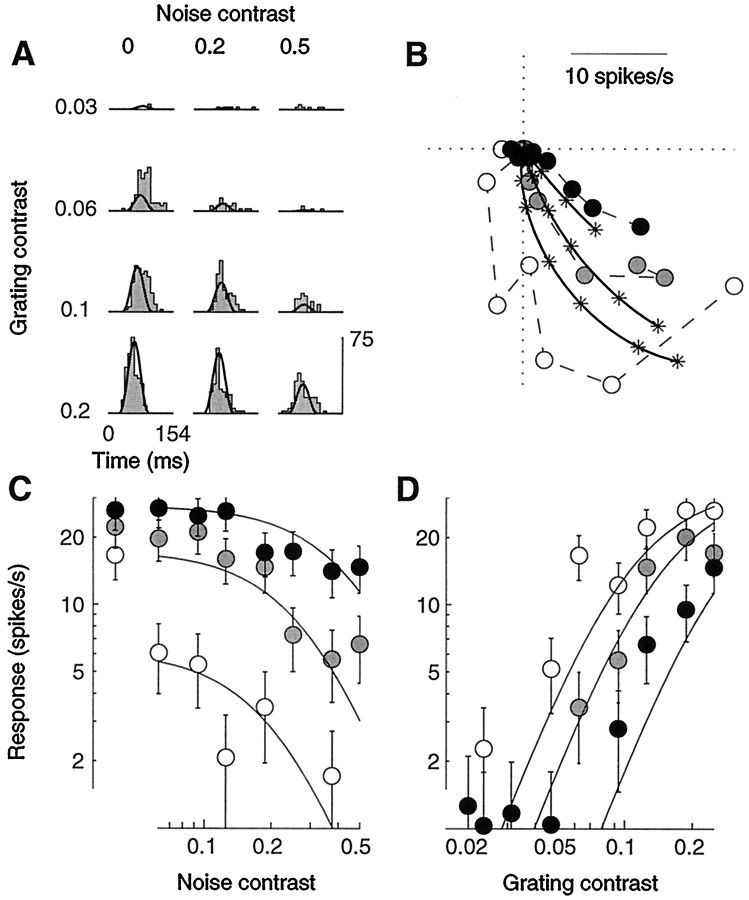
Fig. 14.
Masking with spatiotemporal white noise. An optimal drifting grating was presented together with full-screen two-dimensional flickering binary noise. Fits of the normalization model (curves) were performed on a larger data set than shown, which included 72 stimulus conditions (9 grating contrasts and 8 mask contrasts). A, Period histograms for different grating contrasts (rows) and noise contrasts (columns). When presented alone, the grating elicited strong responses (left column), the noise very weak responses (top row).B, Polar plot of the contrast responses for three different noise contrasts (white to black: 0, 0.19, and 0.5). Increasing noise contrast decreased response amplitude and advanced response phase. Error circles are omitted to avoid clutter but can be estimated from following panels. C, Response amplitude as a function of noise contrast. Grating contrasts (white to black): 0.06, 0.12, and 0.25.D, Response amplitude as a function of grating contrast, for different noise contrasts. Gray levels as in B. Cell 394l015 (DI = 0.6; SF = 2.3; SZ = 6.8° for the stimulus, 7.8° for the mask), experiment 7. Parameters: τ0 = 82 msec; τ1 = 2.6 msec;n = 1.85.

