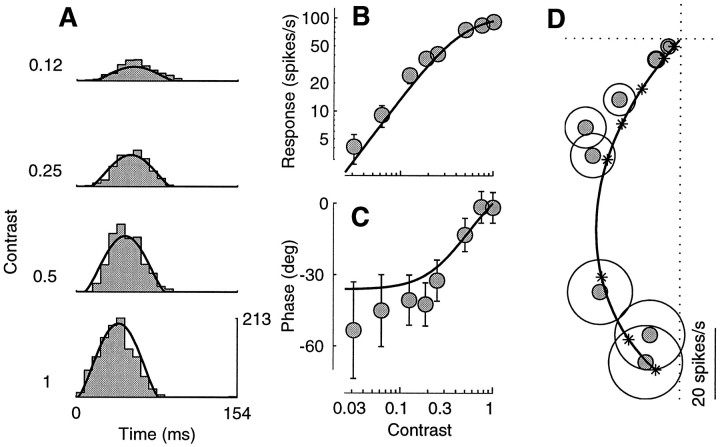
Fig. 3.
Responses to drifting sine gratings of different contrasts. The curves are fits of the normalization model. The fits were performed on a larger data set, which included the responses to 72 different drifting gratings (8 contrasts, 3 orientations, and 3 temporal frequencies). A, Period histograms of the responses to four different contrasts. Scale bar in spikes per second. B, C, Response amplitude and phase as a function of contrast, computed from the first harmonic of the spike trains. D, Polar plot of the responses in B andC. Every point in the plot corresponds to a sinusoid with an amplitude that is given by the distance from the origin, and the phase of which is given by the angle with the horizontal axis. As the contrast increases the responses get larger (far from the origin), and their phases advance (they turn counterclockwise). Asterisks indicate the predictions of the normalization model at the different stimulus contrasts.Circles have radius 1 SEM (N = 3) computed from the estimated variance. Error bars in B andC are ±1 SEM, computed from circles inD. Cell 392l008 [directional index (DI) = 0.1; preferred spatial frequency (SF) = 0.9 cycles/°, stimulus size (SZ) = 4.5°], experiment 4. Parameters: τ0 = 37 msec; τ1= 9 msec; n = 1.34.

