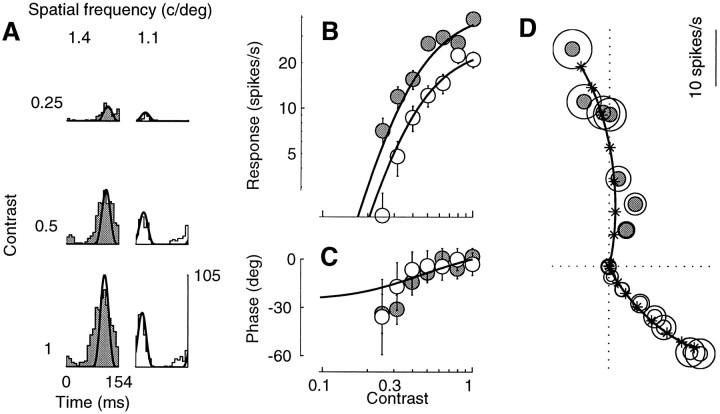
Fig. 5.
Contrast responses for gratings with two different spatial frequencies: 1.4 (gray) and 1.1 (white) cycles/degree. Fits of the normalization model (curves) were performed on a larger data set than shown, which included 40 stimulus conditions (10 contrasts, 2 spatial frequencies, and 2 temporal frequencies). Contrasts <0.12 elicited <1 spike/sec. A, Period histograms. Rows correspond to different contrasts, columns to different spatial frequencies. B, C, Response amplitude and phase as a function of contrast. Responses to each grating in C were shifted vertically so that their values predicted by the model would overlap. D, Polar plot of the responses in B andC. Cell 382l019 (DI = 0.8; SF = 1.4; SZ = 1.9), experiment 5; N = 6. Parameters: τ0= 18 msec; τ1 = 8 msec; n = 4.

