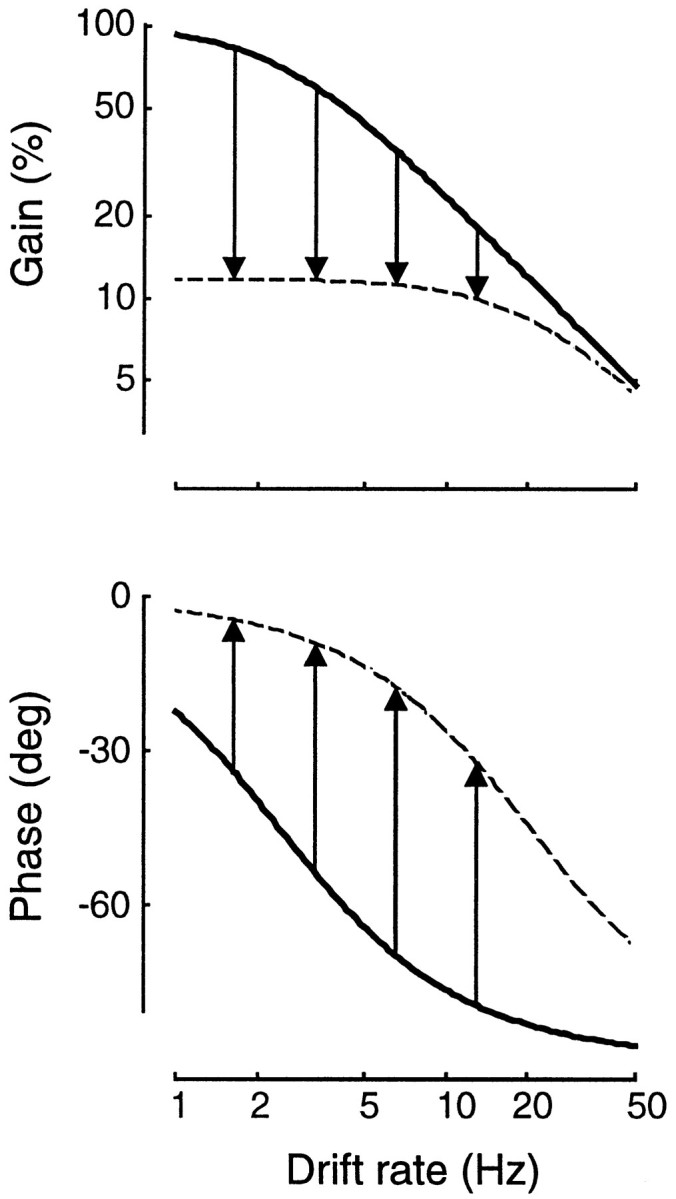
Fig. 7.

Effects of changing the conductance g = 1/R in an RC circuit. Circuit parameters, and their dependence on contrast, are estimated from the experiment in Figure 6.Continuous curves show the transfer function at rest (low conductance); dashed curves show the transfer function at unit contrast (high conductance). Arrows indicate decrease in gain (top) and phase advance (bottom) at four temporal frequencies (1.6, 3.3, 6.5, and 13 Hz).
