
Fig. 2.
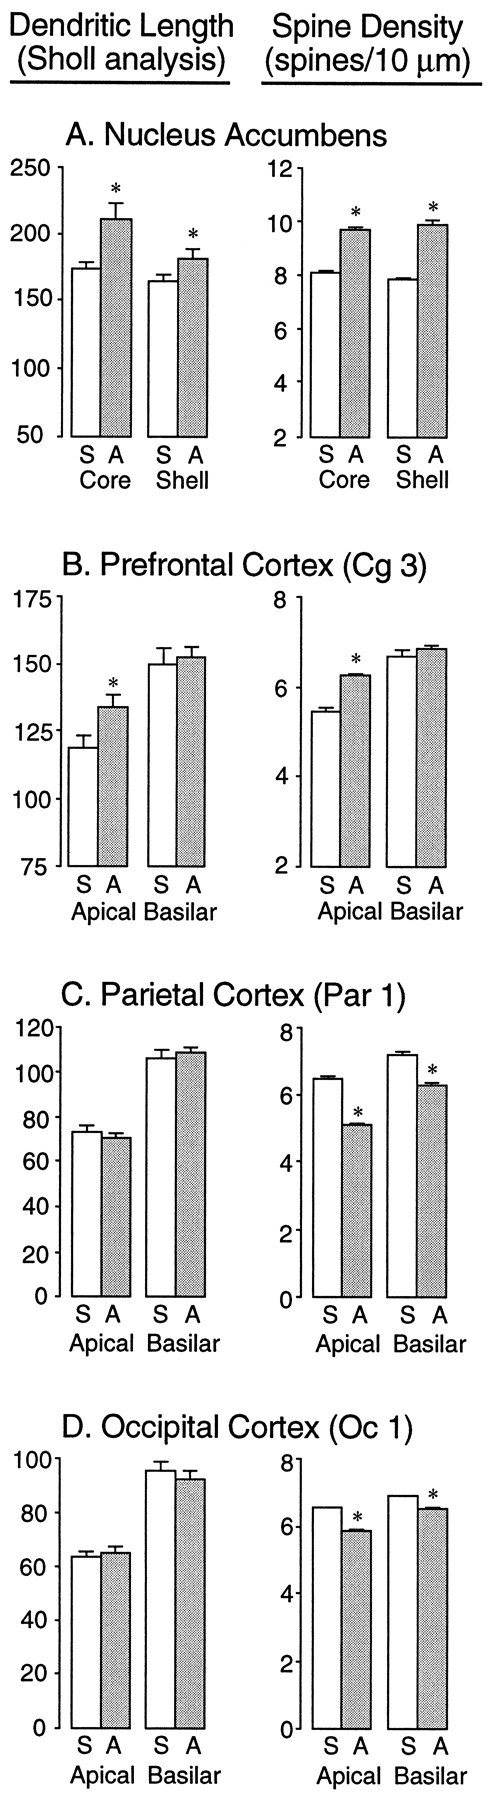
Quantitative analysis of dendritic length (left) and spine density (right) in the nucleus accumbens shell and core subregions (A), the prefrontal cortex (B), the parietal cortex (C), and the occipital cortex (D) of rats treated with saline (indicated byS) or amphetamine (indicated by A). Thebars represent the values of mean plus SEM. Dendritic length was estimated using a Sholl analysis, and therefore thenumbers indicate ring intersections. Spine density refers to the mean total number of spines per 10 μm of dendrite.Asterisks indicate a significant difference between saline- and amphetamine-pretreated groups (see Results).