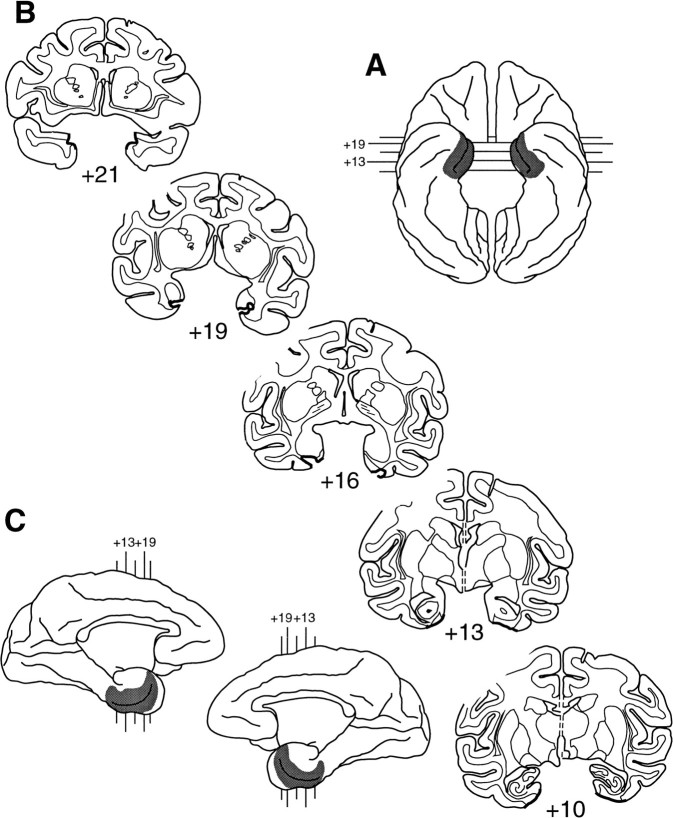
Fig. 3.
Extent of the rhinal cortex lesion in Rh-2.A, Ventral view (reversed to aid in matching to coronal sections). B, Coronal sections; thick black lines indicate the line along which the lesion was made.C, Medial aspect of both hemispheres. In bothA and C, shaded areasindicate the extent of the lesion reconstructed from individual sections. The numerals indicate the distance in millimeters from the interaural plane. Compare and contrast with Figure1.

