Fig. 1.
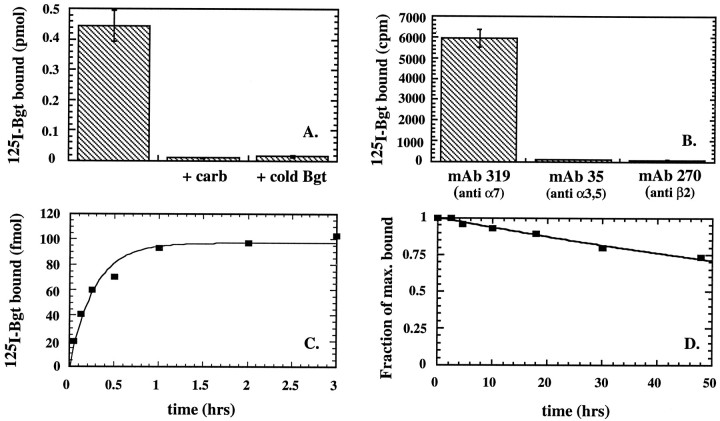
The PC12 BgtR contains α7 subunits and binds Bgt with high affinity. A, The cell surface of PC12 cells was bound with 125I-Bgt in the absence or presence of 10 mm carbachol or 1 mm Bgt. The ligands were added to estimate nonspecific binding. In the absence of ligand, the maximum binding was 0.45 ± 0.05 pmol (mean ± SD) obtained from four 6 cm cultures containing on average 7 × 10⁶ cells. Based on these data, there are ∼40,000 Bgt binding sites per cell. B,125I-Bgt-bound, cell-surface BgtRs from PC12 cells are specifically immunoprecipitated by α7-specific mAb 319, but not by other AChR subunit-specific antibodies. PC12 cells were cell-surface bound with 125I-Bgt and precipitated with mAbs specific for α7 subunit, mAb 319 (Schoepfer et al., 1990), α3 and α5 subunit, mAb 35 (Whiting and Lindstrom, 1986), or β2 subunit mAb 270 (Whiting et al., 1987). Approximately 40% of the total cell-surface-labeled receptors (6000 ± 400 cpm; mean ± SD from from three 6 cm cultures) were precipitated by mAb 319. The counts precipitated by the mAbs specific for the α3, α5, or β2 subunits were indistinguishable from background. C, Estimation of the Bgt association rate. PC12 cells were incubated with 10 nm125I-Bgt at 4°C for the indicated times. Cell-surface-bound 125I-Bgt (in femtomoles) is shown plotted against time of incubation. Each pointrepresents the mean of two 10 cm cultures. The linethrough the points represents a least-squares fit to the data of the equation: 125I-Bgt bound = 1−exp(−k+1t[Bgt]), wherek+1 is the association rate. The results for all experiments are summarized in Table 1. D, Estimation of the Bgt dissociation rate. After PC12 cells were cell-surface-labeled with 125I-Bgt, cultures were incubated in the absence of 125I-Bgt at 4°C for the indicated times. Cell-surface bound 125I-Bgt divided by the value at 0 hr (fraction of maximum bound) is shown plotted against time of incubation. Each point represents the mean of two 10 cm cultures. The line through the points represents a least-squares fit to the data of the equation: fraction of maximum bound = exp (−k−1t), where k−1 is the dissociation rate. The results for all experiments are summarized in Table 1.

