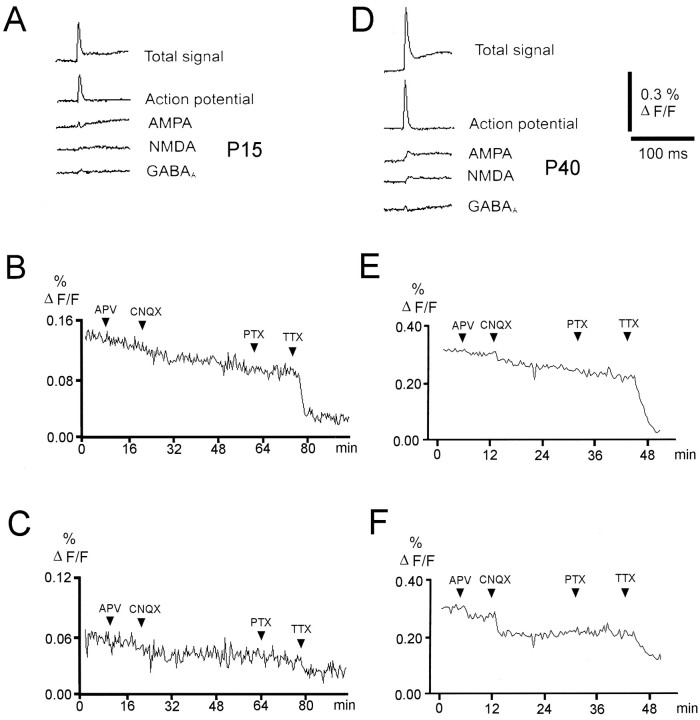
Fig. 1.
Pharmacologically isolated components of the optical signal. Traces represent averages of signals recorded by four adjacent photodiodes close to the stimulating electrode in slices from a young (P15) (A) and a more mature (P40) (D) animal. Upward deflections represent membrane depolarizations. All traces represent averages of 20–30 responses. Different synaptic components were isolated by sequential addition of receptor-selective antagonists and subtraction from the control condition; i.e., except for the “total signal,” the traces result from subtractions. B, C, E,and F show the time course of drug-induced changes in the maximum amplitude averaged among all 100 photodiodes every 25 sec (which was the standard intertrial interval). For B andE, the first 20 msec of the signal were averaged; i.e., each point contains both the first action potential-dominated component of the optical response and the later components, which are dominated by synaptic signals. In C and F, 15 msec of the total trace starting 5 msec after the stimulus onset have been averaged; i.e., the initial spike component has been ignored to show antagonist effects on different components of the synaptically mediated response component at higher resolution. The relative contribution of synaptic components as compared with the fast, initial action potential component to the total signal increases with postnatal age. The typical response consisted of early and late glutamatergic excitatory components, occasionally separated by a GABAAreceptor-mediated component, which is visible as a small hyperpolarization in a number of recordings (D).

