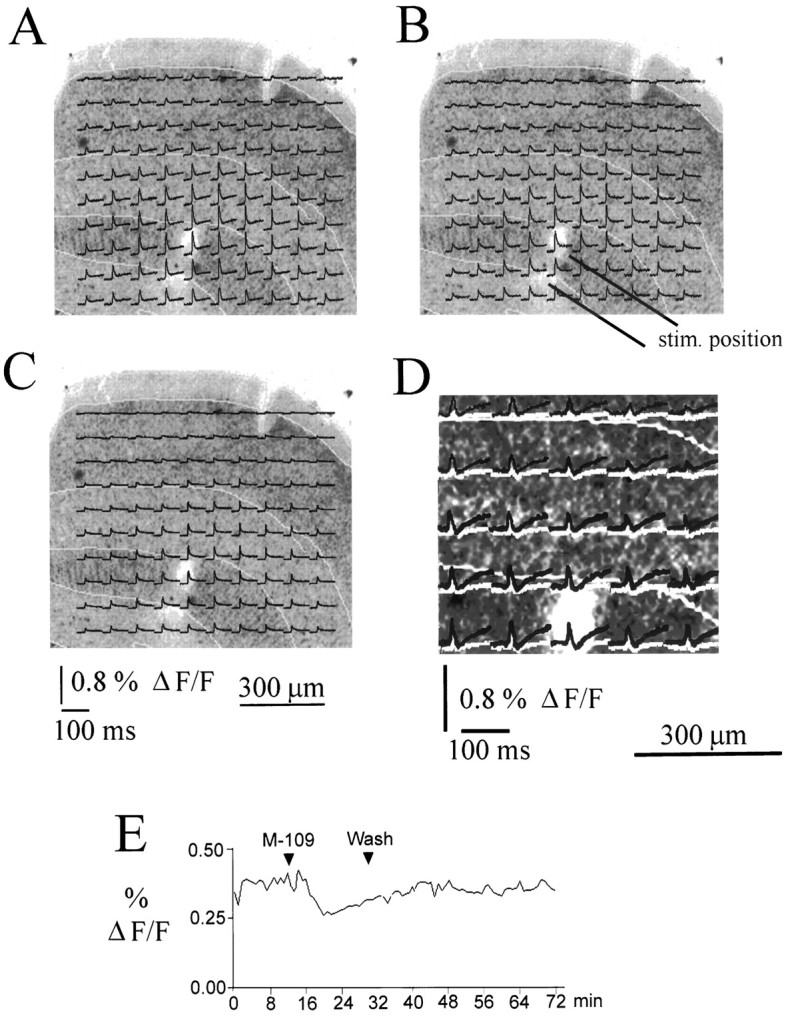
Fig. 2.

Reduction of response amplitudes after application of the 5-HT3 receptor ligand M-109. A–D, Optically recorded traces overlaid on a Nissl-stained section from a P34 animal. Laminar boundaries are indicated by yellow lines. All traces represent averages of 20 stimulations. M-109 reduced the response amplitude in all layers. D shows the difference between the control response and the response recorded in the presence of M-109 (red traces) and the difference between control and recovery (green traces) at expanded vertical scale for a selection of traces close to the stimulation site. The difference between control responses and responses recorded in the presence of M-109 is clearly larger than the difference between control and recovery traces, demonstrating that the inhibitory effect of 5-HT3 receptor activation is clearly distinct from rundown. E shows the time course of the maximum amplitude of the optically recorded response (averaged over all 100 photodiodes and the first 20 msec after stimulus onset) for the entire duration of the experiment. The reduction of the response amplitude induced by M-109 and the reversibility of the effect are clearly shown.
