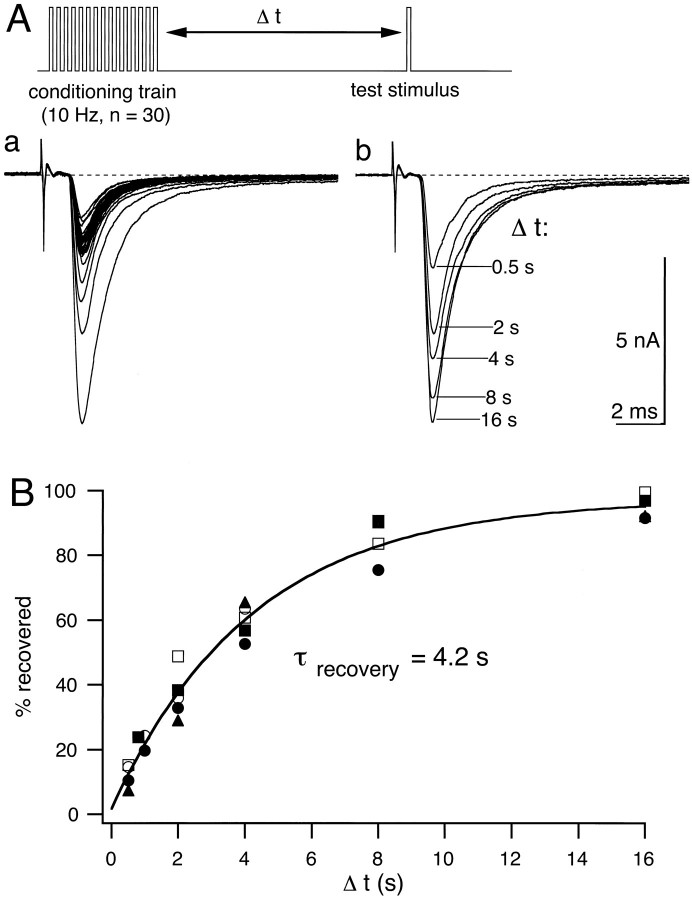
Fig. 3.
Recovery time course from depression induced at 10 Hz. Conditioning trains of 30 stimuli at 10 Hz were followed by single test stimuli at varying intervals from 0.5 to 16 sec.Aa, A representative example of AMPA EPSCs recorded at a holding potential of −80 mV during a conditioning train.Ab, Five AMPA EPSCs recorded in the same cell as forAa after recovery intervals Δt varying between 0.5 and 16 sec. Note that after 0.5 sec only ≈15% of the decrement in EPSC amplitude induced by depression has recovered.B, Recovery time course from depression, expressed as the percentage of EPSC decrement (Id =I0 − Iss; see also Fig. 7B). Data from five cells were fit by a single exponential function with a time constant τ = 4.2 sec.

