
Fig. 4.
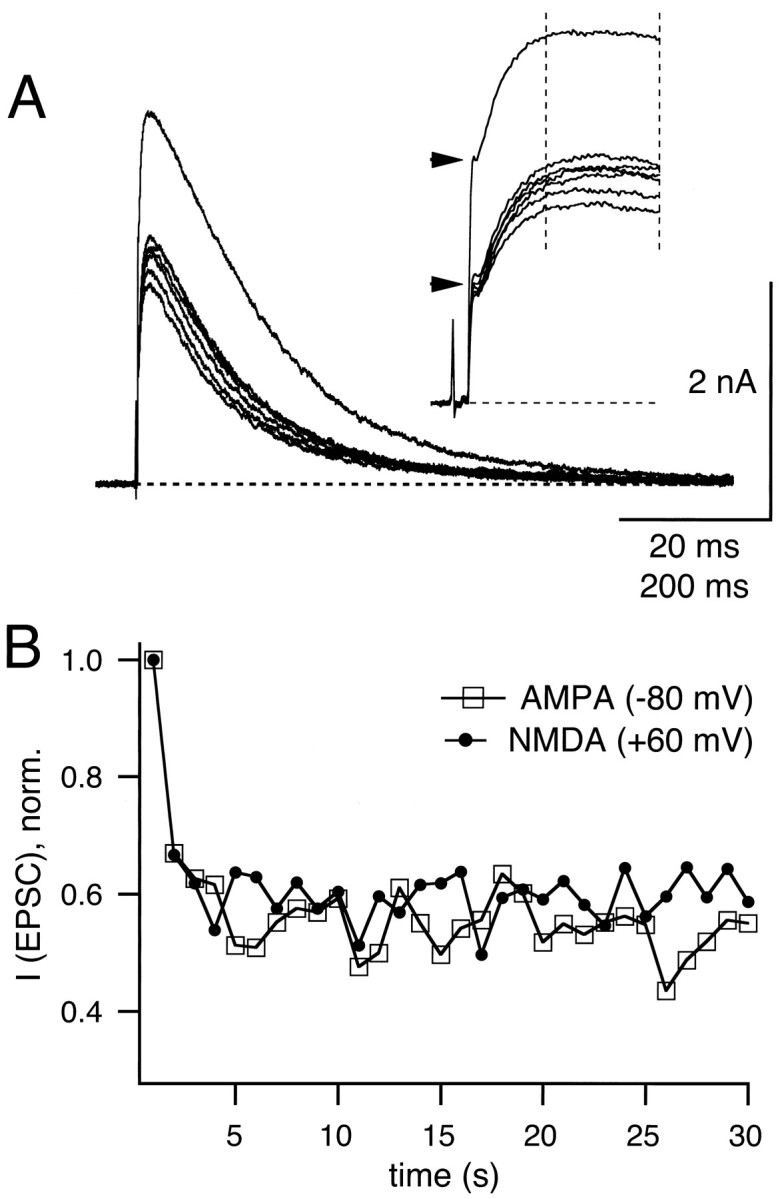
Depression of NMDA receptor-mediated EPSCs.A, EPSCs were elicited at 1 Hz at a holding potential of +60 mV. The first seven traces in a train of 30 stimuli are shown. A Cs-gluconate-based internal pipette solution was used (see Materials and Methods), and 100 μm glycine plus 2 μmstrychnine were added to the external solution. Insetshows the initial part of the same data on an expanded time scale (time bar = 20 msec). The horizontal arrowheads indicate the peak amplitude of the first and the depressed AMPA receptor-mediated component of the EPSCs at a holding potential of +60 mV. The vertical dotted lines on theinset indicate the time window from which the peak NMDA receptor-mediated component of the EPSC was obtained. B, Time course of depression of NMDA EPSC (closed symbols) and AMPA EPSCs (open symbols; recorded at −80 mV) for a 1 Hz train recorded from the same cell as shown in A. EPSC amplitude values were normalized toI0.