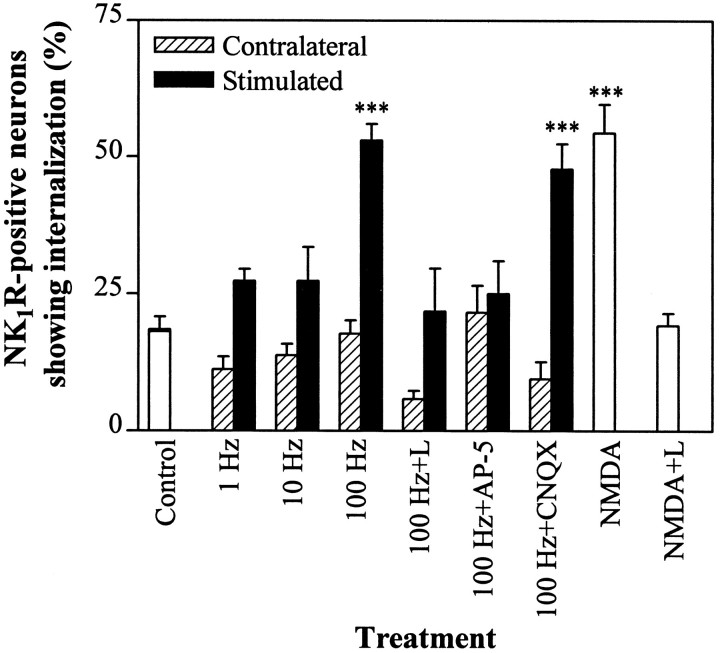
Fig. 4.
Percentage of NK1R-positive neurons in laminae I–IIo showing internalization after dorsal root stimulation or incubation with NMDA. One dorsal root was used to stimulate the corresponding side of the slice, whereas the contralateral side served as control. Open barsrepresent slices that were not electrically stimulated; filled bars represent the stimulated side of the slices; andhatched bars represent the contralateral side. Stimulation was as follows: Control, no stimulation;1 Hz, one train of 5 min at 1 Hz; 10 Hz, three trains of 10 sec at 10 Hz every 10 sec; 100 Hz, three trains of 1 sec at 100 Hz every 10 sec; 100 Hz+L, 5 μm L-703,606 perfused for 10 min before and after 100 Hz; 100 Hz+AP-5, 50 μm AP-5 perfused for 5 min before and after 100 Hz; 100 Hz+CNQX, 5 μm CNQX perfused for 10 min before and after 100 Hz;NMDA, 100 μm NMDA for 1 min followed by ACSF for 10 min; NMDA+L, 100 μm NMDA for 1 min and 5 μm L-703,606 for 10 min before and after NMDA. Values are mean ± SEM of four slices (control, 100 Hz, 100 Hz+CNQX, NMDA) or three slices (rest). ***Significantly different from control (p < 0.001, ANOVA and Bonferroni’s test); these three bars are also significantly different (p < 0.05) from any other bars in the figure.

