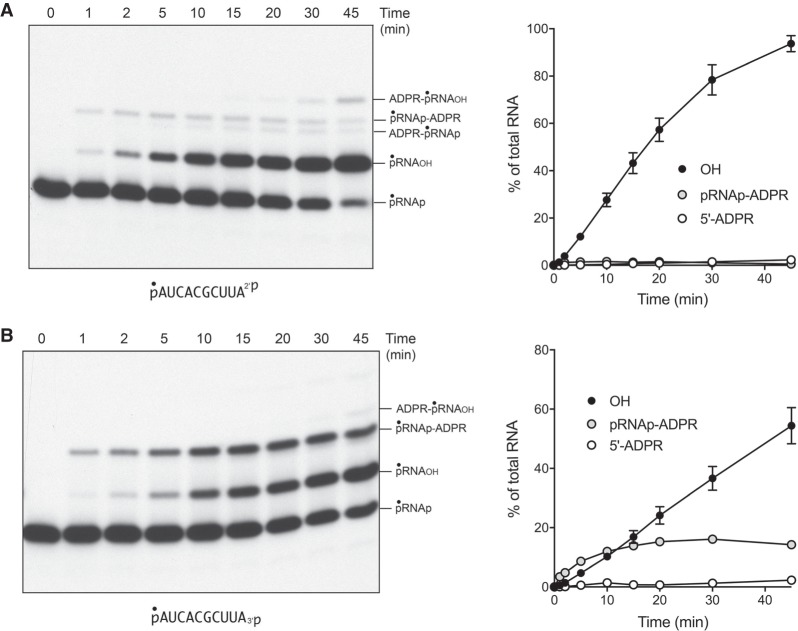
FIGURE 2.
Temporal profile of RNA terminal 2′-PO4 and 3′-PO4 removal by CthTpt1. Reaction mixtures (100 µL) containing 100 mM Tris-HCl, pH 7.5, 1 mM NAD+, 0.2 µM (20 pmol) 5′ 32P-labeled 10-mer pRNA2′p, or pRNA3′p substrates (shown at bottom), and 0.5 µM (50 pmol) CthTpt1 were incubated at 37°C. Aliquots (10 µL) were withdrawn at the times specified and quenched immediately with three volumes of cold 90% formamide, 50 mM EDTA. The products were analyzed by urea-PAGE and visualized by autoradiography (A,B, left panels). The identities of the radiolabeled RNAs are indicated on the right. The kinetics of terminal phosphate removal were quantified in the right panels by plotting the sum of the pRNAOH and ADPR-pRNAOH species (expressed as the percent of total labeled RNA) as a function of reaction time (OH). The kinetics of 5′ capping were evident as the sum of the ADPR-pRNAOH and ADPR-pRNAp species plotted as a function of time (5′-ADPR). Also quantified was the pRNAp-ADPR intermediate. Each datum in the graphs is the average of three independent time course experiments ±SEM.

