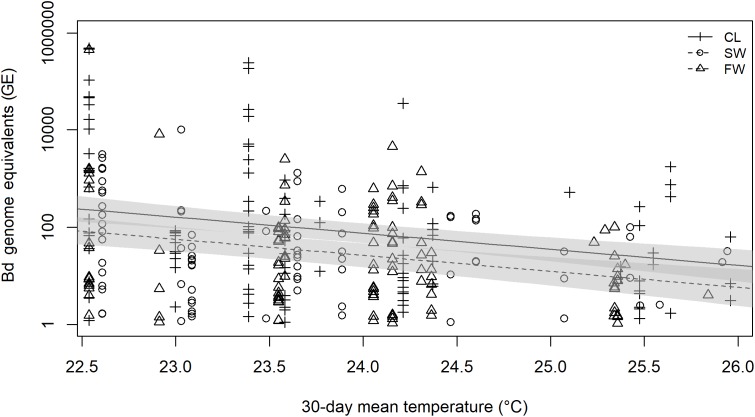
Figure 4. Linear model prediction of relationship between 30-day mean temperature, site and Batrachochytrium dendrobatidis infection load of infected E. johnstonei on Montserrat.
Batrachochytrium dendrobatidis genome equivalents (GEs) were log transformed prior to analysis as they spanned several orders of magnitude and resulted in heavily skewed, non-normal model residuals. A total of 95% CI are plotted for CL and SWG model predictions. No model prediction is plotted for FW as it was very similar to the prediction for SWG.

