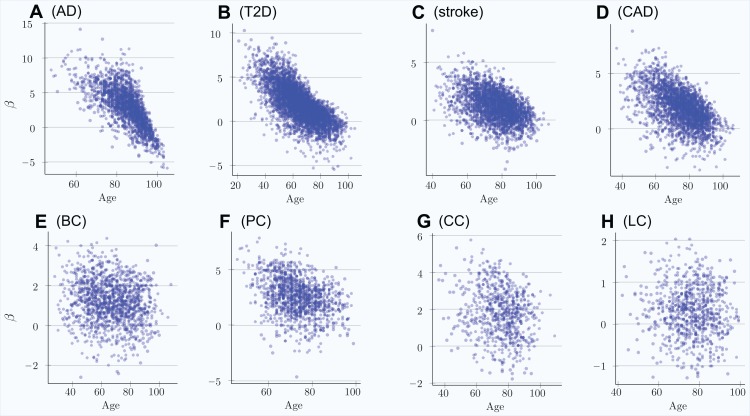
Figure 1. Polygenic risk scores of individuals diagnosed with an LOD as a function of age.
(A) Alzheimer’s disease, (B) type 2 diabetes, (C) cerebral stroke, (D) coronary artery disease, (E) breast cancer, (F) prostate cancer, (G) colorectal cancer, (H) lung cancer. Scatter plots show the distributions of PRS for cases diagnosed as age progresses, with ongoing mortality. Beta = log(OddsRatio) visually implies the underlying heritability and incidence magnitudes. If the regression line can be easily drawn, dropping diagonally as age progresses, there is a combination of high heritability and increasing cumulative incidence. Otherwise, a plot appears as a relatively symmetrical blob.

