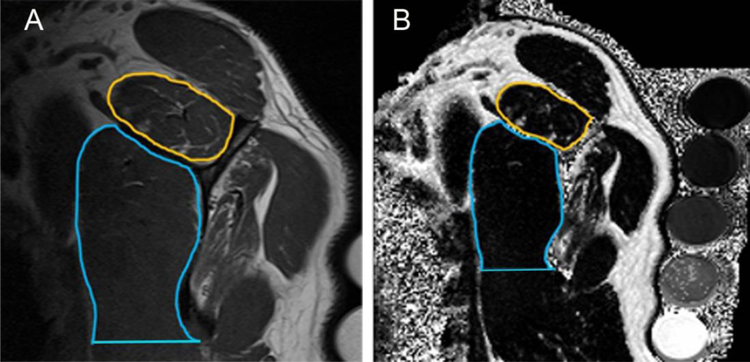
Fig. 2.
Method for calculation of visualized intramuscular fat area percentage and muscle fat fraction on (a) oblique sagittal T1-weighted and (b) corresponding Dixon MR images. An ROI was drawn around the border of every individual muscle (as depicted by the gold ROI on both images for the supraspinatus muscles) in the study with one exception. A line perpendicular to the inferior scapular border marked the inferior extent of the subscapularis muscle included in the ROI (blue ROI).

