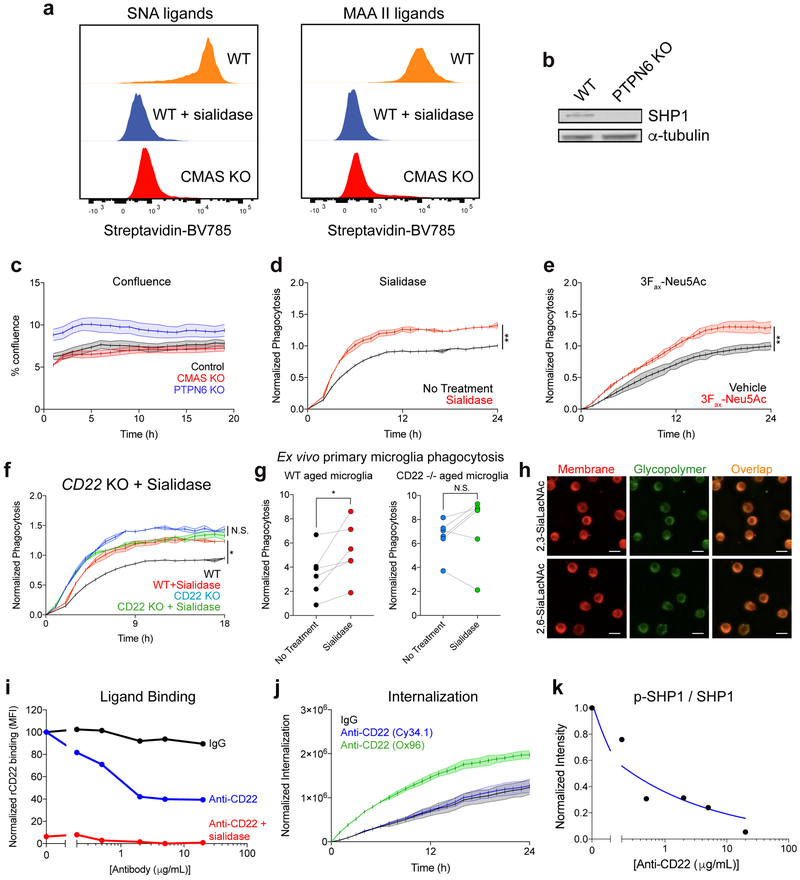
Extended Data Figure 4. Sialic acid-CD22-SHP1 signaling regulates phagocytosis.
a, Sambucus nigra agglutinin (SNA, recognizes α2,6-linked sialic acid) and Maackia amurensis agglutinin II (MAA II, recognizes α2,3-linked sialic acid) ligand expression in WT BV2 cells (orange), WT BV2 cells pretreated with sialidase (blue), and CMAS KO cells (red) assessed by flow cytometry. Sialidase treatment and CMAS KO reduce sialic acid ligands on the cell surface.
b, Western blot showing SHP1 protein expression in WT and PTPN6 KO BV2 cells. For raw source image, see Supplementary Figure 1.
c, Percent confluence of control (gray), CMAS KO (red), and PTPN6 KO (blue) BV2 cells during time-lapse microscopy phagocytosis assays (n=3, mean +/− s.e.m.).
d, e, Phagocytosis of pH-sensitive fluorescent beads by untreated (black) and sialidase-treated (red) BV2 cells (d) or vehicle-treated and 3Fax-Neu5Ac-treated BV2 cells prior to phagocytosis (n=3, **P<0.005, two-sided t-test; mean +/− s.e.m).
f, Phagocytosis of pH-sensitive fluorescent beads by WT (black), WT + sialidase (red), CD22 KO (blue), or CD22 KO + sialidase (green) BV2 cells (n=3, *P<0.05, N.S. not significant, one-way ANOVA with Tukey’s multiple comparisons correction; mean +/− s.e.m.).
g, Microglia were acutely isolated from the brains of aged (18 m.o.) WT (left) or CD22 −/− (right) mice, treated with or without sialidase, and incubated with pH-sensitive fluorescent latex beads. Microglia specific phagocytosis was measured using flow cytometry (n=6, *P<0.05, N.S. not significant, paired two-sided t-test).
h, Representative images of BV2 cells coated with AlexaFluor 488 conjugated glycopolymers (green) and stained with a plasma membrane-specific dye (CellMask, red) showing overlap (yellow). Scale bar = 25 microns.
i, Recombinant mouse CD22-human Fc fusion protein was pre-complexed with AF647 anti-human Fc secondary antibody, treated with various concentrations of IgG (black) or anti-CD22 (blue, red), and subsequently allowed to bind to ligands on the surface of BV2 cells or BV2 cells pretreated with sialidase (red). Binding was measured by flow cytometry.
j, Internalization of IgG (black), function blocking anti-CD22 (clone Cy34.1, blue), and non-function-blocking anti-CD22 (clone OX96, green) conjugated to a pH-sensitive fluorescent dye by BV2 cells assessed by time-lapse microscopy (n=3, mean +/− s.e.m.).
k, Western blot quantification of ratio of active pSHP1 to total SHP1 protein in BV2 cells pretreated with various concentrations of anti-CD22. Blue line represents the fitted variable slope inhibitor-response curve. For raw source image, see Supplementary Figure 1.
All data were replicated in at least 2 independent experiments.

