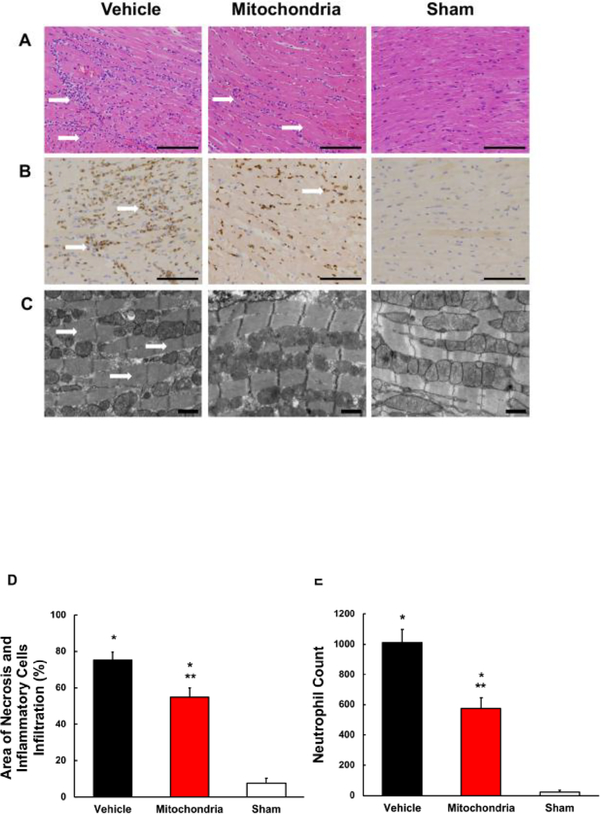
Fig. 5.
Myocardial tissue injury and neutrophil infiltration at 24 hours of reperfusion. (A) Representative H&E micrographs of heart grafts tissue sections. Tissue sections from Mitochondria heart grafts show significantly less severe necrosis and inflammatory cells infiltration as compared to Vehicle heart grafts. Sham heart grafts show only minimal myocardial injury and inflammatory cells infiltration. Scale bars, 100 μm. (B) Representative micrographs of tissue sections from heart grafts stained for myeloperoxidase content to quantify neutrophil infiltration. Tissue sections from Mitochondria heart grafts show decreased neutrophil infiltration as compared to Vehicle heart grafts. Tissue sections from Sham heart grafts show no neutrophil infiltration. Scale bars, 100 μm. (C) Representative transmission electron micrographs. Transmission electron microscopy analysis shows similar profile in Mitochondria and Sham heart grafts, with no observed contraction bands, while Vehicle heat grafts show contraction bands indicating myocardial injury. Scale bars, 1 μm. (D) Area of necrosis and inflammatory cells infiltration in the entire transversal tissue sections of Vehicle, Mitochondria and Sham heart grafts. Results show significantly less necrosis and inflammatory cells infiltration in Mitochondria heart grafts as compared to Vehicle. (E) Neutrophil count determined by positive myeloperoxidase staining counted in 5 random (20x) visual fields per tissue section. Results show significantly lower neutrophil infiltration in Mitochondria heart grafts as compared to Vehicle. All values are mean ± SEM. *P < 0.05 vs. Sham. **P < 0.05 vs. Vehicle. n = 8 for Mitochondria, 9 for Vehicle, 4 for Sham.

