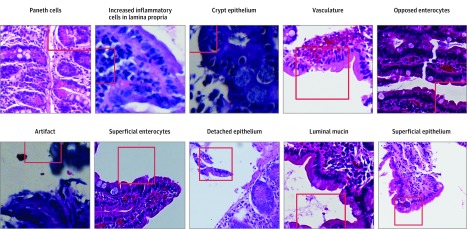
Figure 3. Deconvolution Groupings.
We selected 151 deconvolutions from hematoxylin-eosin–stained duodenal biopsies for interpretation (original magnification ×40); the 10 groupings the model identified are shown. Red boxes and lines indicate the pixel configuration that the deconvolution model considered an area of importance. Each of these features was used by the model in its decision-making process, but the relative importance of each feature is unknown.

