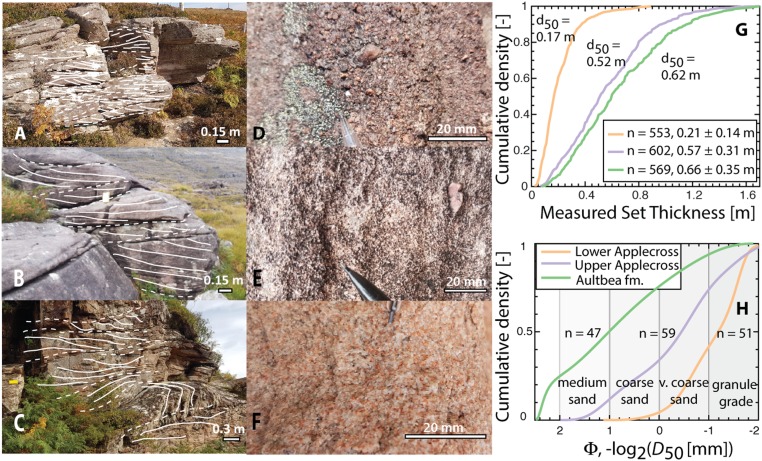
Fig. 2.
Summary of field data collected for the Torridonian Group. (A–C) Cross-stratification in the LAF, UAF, and the Aultbea Formation, respectively. The solid and dashed lines indicate cross-bedding and the interpreted erosional boundaries, respectively (Materials and Methods and SI Appendix, Figs. S1–S3). (D–F) Macro photographs showing the reduction in grain size from the LAF to the Aultbea Formation (SI Appendix, Figs. S1–S3). Cumulative distribution function of the measured set thickness (G) and median grain size (H) at individual outcrops within the stratigraphic sampling intervals.

