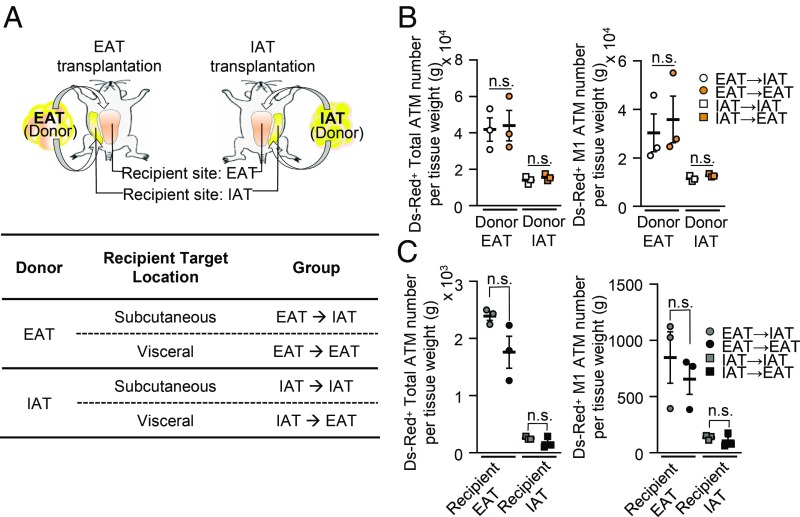
Fig. 2.
Intrinsic characters of fat depot determine ATM infiltration in DIO. (A) Illustration of adipose tissue transplantation. Each donor sample of obese IAT or obese EAT was transplanted at either a subcutaneous or a visceral location in HFD-fed recipient mice. Nomenclature of transplanted donor adipose tissues from each group is indicated in the table below the illustration. (B) Comparison of the amounts of Ds-Red+ ATM infiltration (Left) and M1-like ATMs (Right) in transplanted donor adipose tissues. (C) Comparison of the number of Ds-Red+ ATMs (Left) and M1-like ATMs (Right) infiltrated in recipient adipose tissues. Error bars represent means ± SEs of treatment groups. n.s., not significant. n = 3 for each experimental group.

