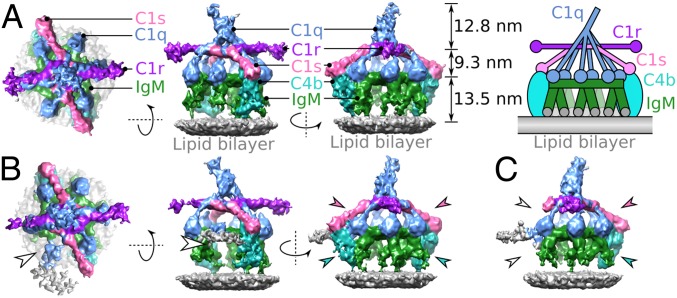
Fig. 1.
IgM-C1-C4b complexes imaged by phase-plate cryoelectron tomography. (A) Top and two side views of the hexameric IgM-C1-C4b2 density map. Shown are assemblies containing C1q (blue), two molecules of C1r (purple), two molecules of C1s (pink), hexameric IgM (green), and two molecules of C4b (cyan) formed on liposome bilayers (gray). (Right) Relative heights of components are indicated along with a simplified schematic of the complex. (B) Density map of the pentameric IgM-C1-C4b2 complex indicating two molecules of C4b (cyan arrowheads) and two C1s arms (pink arrowheads). Weak density is observed for the C1q leg above empty space and noisy density of pentameric IgM (white arrowhead). (C) Density map of the pentameric IgM-C1-C4b1 complex, showing a single molecule of C4b (cyan arrowhead) and the associated C1s CCP1/2-SP domains (pink arrowhead). On the opposite side disordered noisy density (gray) and increased flexibility of C1s due to the absent C4b molecule are apparent as missing density (white arrowheads).

