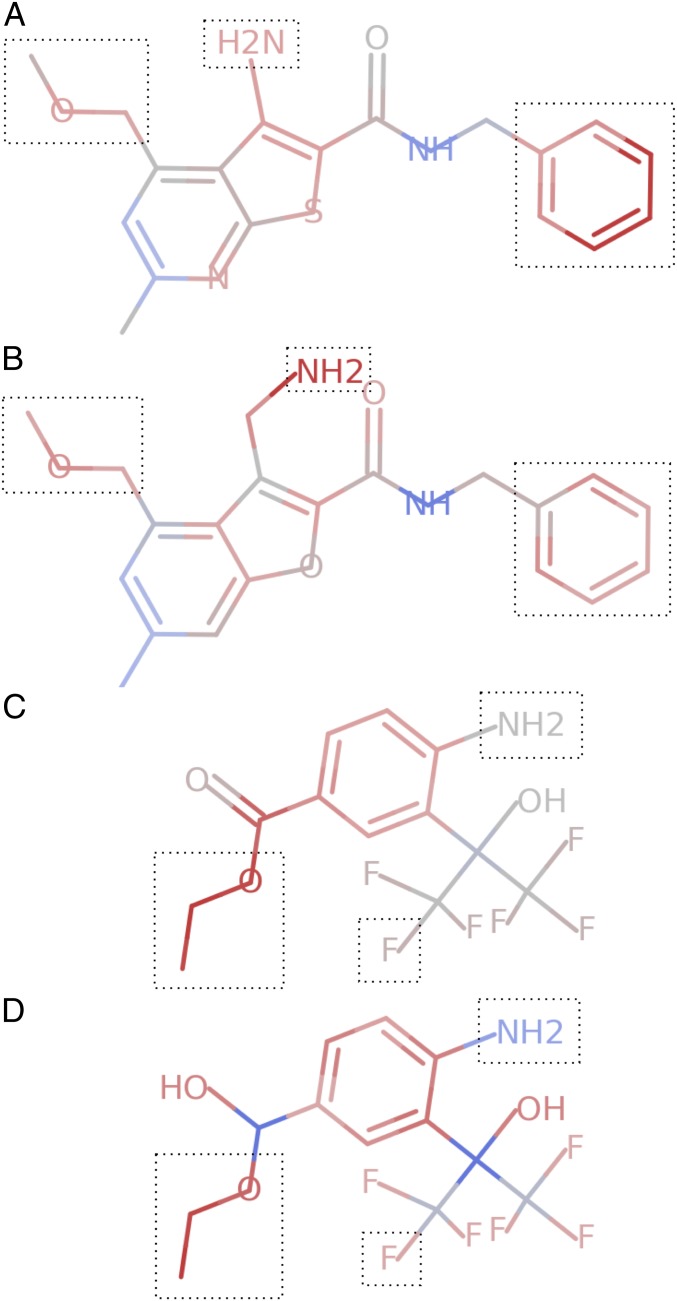
Fig. 3.
Visualizations of attribution scores, calculated using Integrated Gradients. (A) Attribution scores for a molecule from the logic 9 held-out set that obeys the binding logic. (B) A minor perturbation of the above molecule, guided by errors in the attributions shown in A, which gets misclassified by the model. (C) Attribution scores for a molecule from the logic 12 held-out set that obeys the binding logic. (D) A minor perturbation of the above molecule which still obeys the logic, but is misclassified by the model. Dotted boxes are added around the fragments whose presence defines the molecules as members of the positive class.

