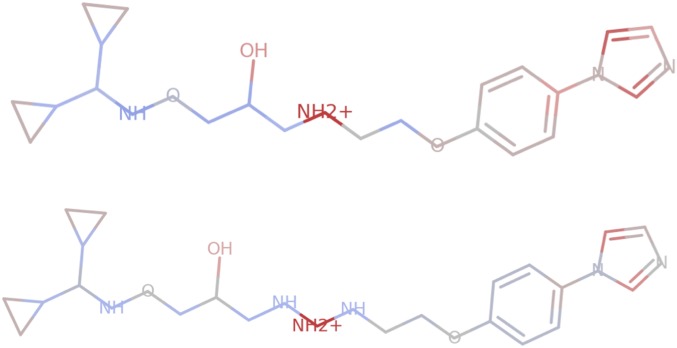
Fig. 4.
Visualizations of Integrated Gradients attributions. (Top) An example “binder” from the synthetic ADRB2 dataset, correctly predicted as a positive with prediction 0.999. (Bottom) A minor perturbation of the above molecule which should be a negative but gets misclassified as still a positive with prediction 0.995.

