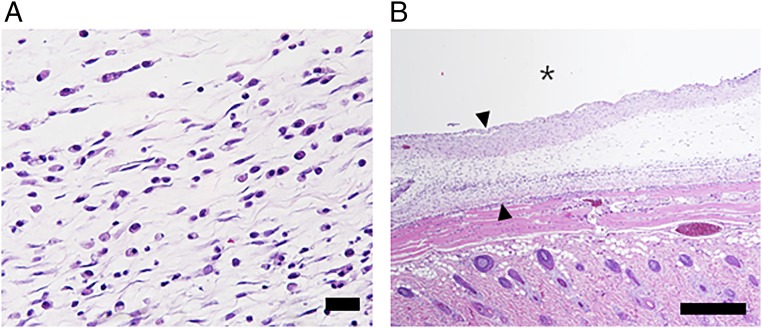
Fig. 5.
Representative image of the hematoxylin and eosin (H&E)-stained tissues around the implanted device. The degree of inflammatory response was evaluated on H&E-stained tissues biopsied at the end point of experiments (14 d after implantation). The images were acquired at (A) 200× and (B) 50× magnifications for evaluation of inflammation and capsule thickness, respectively. The asterisk (*) indicates the location of the implanted device. The arrows indicate the capsule formed around the implanted device. (Scale bars: A, 200 μm; B, 500 μm.)

