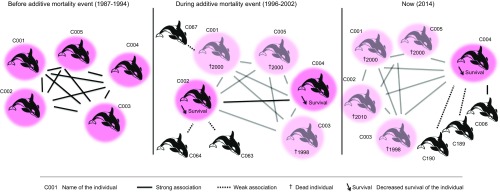
Fig. 2.
Graphical summary of the findings: consequences of an additive mortality event on the social structure and survival of killer whales (example of the C001 social unit). Individuals are named with the code “CXXX”. The social unit is represented with pink color; full lines represent strong associations, whereas dashed lines represent weak associations. Dead individuals are represented in faded color with a cross and the year of their death. An arrow labeled with “Survival” next to an individual indicates a decrease in the survival of that individual.

