Fig. 2.
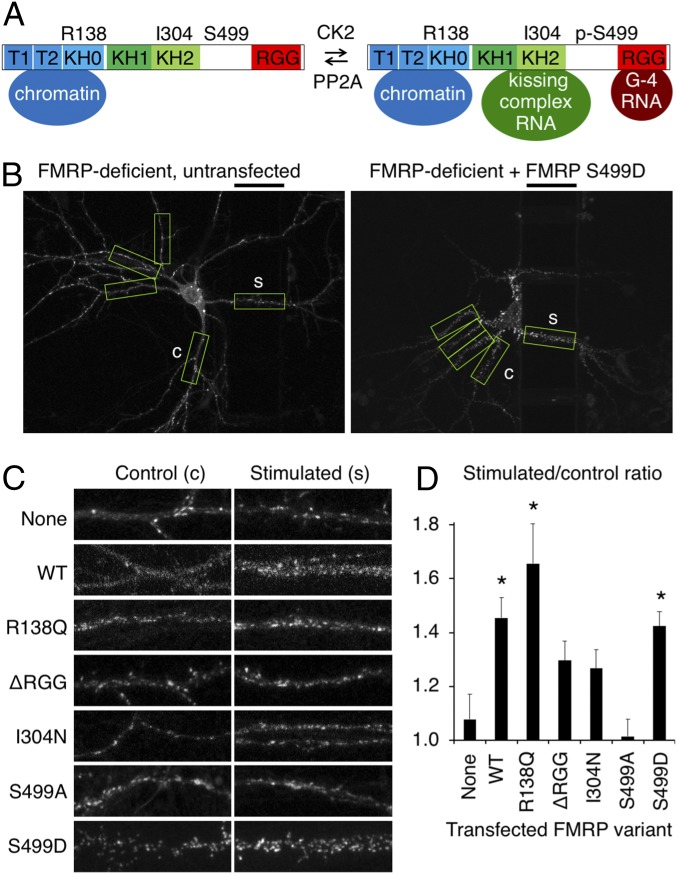
Translational repression by FMRP is required cell-autonomously for BDNF-induced local expression of new PSD95. (A) Diagram of FMRP protein interactions disrupted by mutations. KH, heterogeneous nuclear ribonucleoprotein K homology domain; T, Tudor domain. (B) Representative images of new PSD95 in FMRP-deficient neurons expressing RFP only (Left) or FMRP S499D (Right) 21–24 h after local BDNF stimulation. The black bars above the images indicate the location of the barrier and provide a 50-μm scale bar. BDNF was applied to the right of the barrier. Boxes indicate stimulated and equidistant control regions identified and analyzed by the automated algorithm. (C) Representative stimulated and control regions for each transfected FMRP variant. Whole-neuron images are in SI Appendix, Fig. S3. (D) Relative intensities of stimulated versus unstimulated control dendritic segments. Error bars represent SEM. Untransfected, n = 10 neurons; WT, n = 11 neurons, *P = 0.008; R138Q, n = 14 neurons, *P = 0.01; ΔRGG, n = 21 neurons, P = 0.11; I304N, n = 17 neurons, P = 0.18; S499A, n = 13 neurons, P = 0.58; S499D, n = 15 neurons, *P = 0.005 [each condition vs. untransfected by Student’s t test with Tukey’s correction, after ANOVA test with F (6, 95) = 5.77, P = 3.7 × 10⁻⁵].

