Fig. 3.
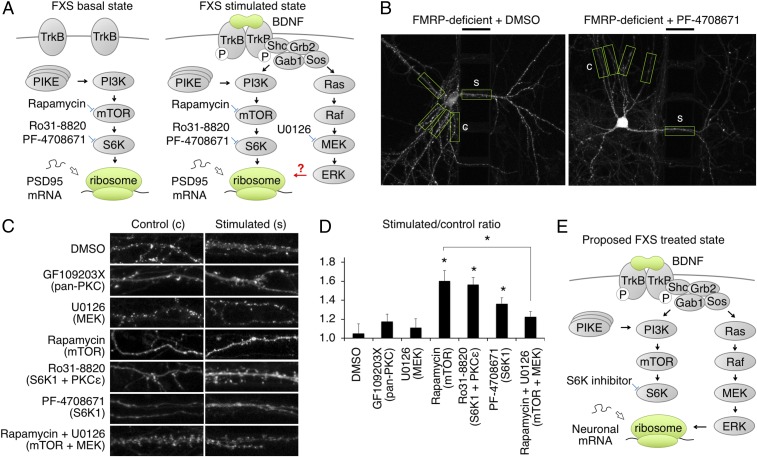
Inhibition of mTOR or S6K1 rescues BDNF-induced new PSD95 accumulation in FMRP-deficient neurons. (A) Proposed model of mTORC1-S6K1 pathway hyperactivity in FMRP-deficient neurons, occluding induction of local protein synthesis by stimuli. (B) Representative images of new PSD95 in FMRP-deficient neurons 21–24 h after local BDNF stimulation with DMSO (Left) or 10 μM S6K1 inhibitor PF-4708671 (Right). The black bars above the images indicate the location of the barrier and provide a 50-μm scale bar. BDNF was applied to the right of the barrier. Boxes indicate stimulated and equidistant control regions identified and analyzed by the automated algorithm. (C) Representative stimulated and control regions of neurons with DMSO, 2 μM pan-PKC inhibitor GF109203X, 20 μM MEK inhibitor U0126, 10 μM mTORC1 inhibitor rapamycin, 2 μM S6K1/PKC inhibitor Ro31-8820, 10 μM S6K1 inhibitor PF-4708671, or 10 μM rapamycin + 20 μM U0126 added to the stimulated dendrites together with BDNF. (D) Relative intensities of stimulated versus unstimulated control dendritic segments. Error bars represent SEM. DMSO, n = 12 neurons; GF109203X, n = 10 neurons, P = 0.35; U0126, n = 13 neurons, P = 0.67; rapamycin, n = 16 neurons, *P = 0.001; Ro31-8820, n = 12 neurons, *P = 0.0005; PF-4708671, n = 11 neurons, *P = 0.02; rapamycin + U0126, n = 13 neurons, P = 0.13 [each condition vs. DMSO by Student’s t test with Tukey’s correction, after ANOVA test with F (6, 81) = 5.67, P = 5.9 × 10⁻⁵]. The difference between rapamycin and rapamycin + U0126 was also statistically significant (*P = 0.01). (E) Proposed treatment model for FXS.

