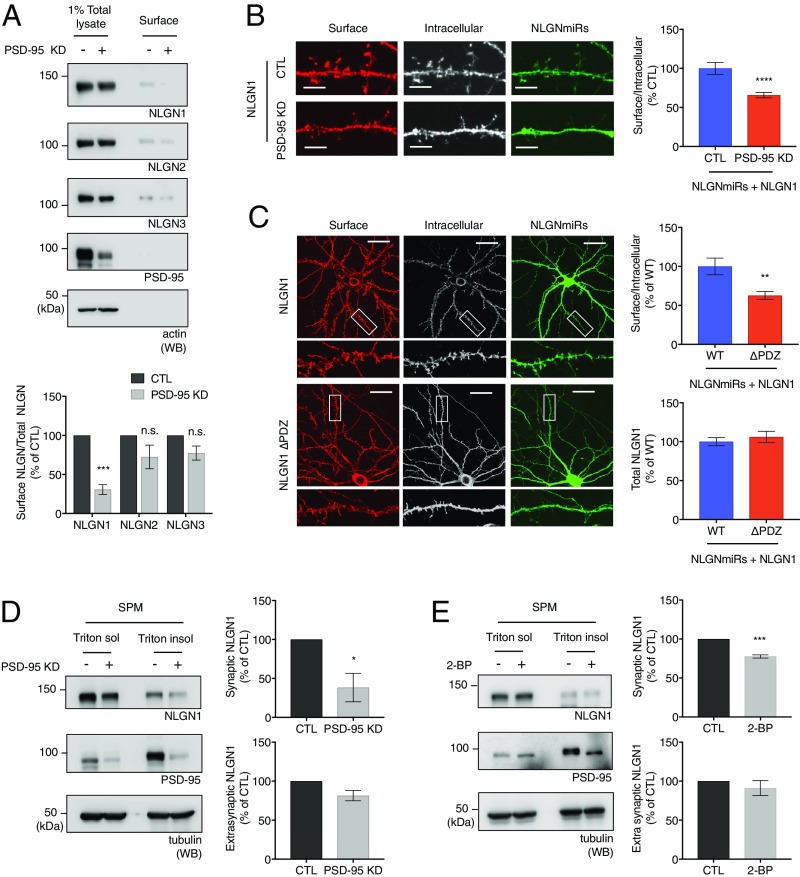
Fig. 1.
NLGN1 and PSD-95 binding regulates NLGN1 surface levels. (A) Cultured cortical neurons were transduced with shPSD-95 lentivirus at DIV 12 to 15. The surface biotinylation assays were performed 7 d after viral transduction. Surface proteins were analyzed by immunoblotting. Graph indicates mean ± SEM (n = 3). ***P = 0.0002 using one-way ANOVA Bonferroni’s multiple comparison test. n.s., not significant. (B) PSD-95 knockdown plasmid was cotransfected with NLGN miRs and HA-NLGN1 WT in cultured hippocampal neurons (n = 14 for CTL and n = 17 for PSD-95 knockdown). (Scale bar, 5 µm.) (C) HA-NLGN1 or HA-NLGN1 ∆PDZ were cotransfected with NLGN miRs in cultured hippocampal neurons (n = 13 for WT and n = 15 for ∆PDZ). (Scale bar, 25 µm.) (B and C) Surface labeling assays were performed as described in Materials and Methods. Regions from three dendrites per each neuron were collected for analysis. Graph indicates mean ± SEM **P = 0.0015 and ****P = 0.000032 using unpaired t test. (D and E) Cultured cortical neurons were transduced with shPSD-95 lentivirus or treated with 100 μM 2-BP for 20 h. The Triton-soluble extrasynaptic region and Triton-insoluble synaptic region were fractionated from the neurons. The fractions were analyzed by immunoblotting. The NLGN1/tubulin ratio was analyzed. The graph indicates mean ± SEM (n = 3). *P = 0.028 and ***P = 0.0004 using unpaired t test.

