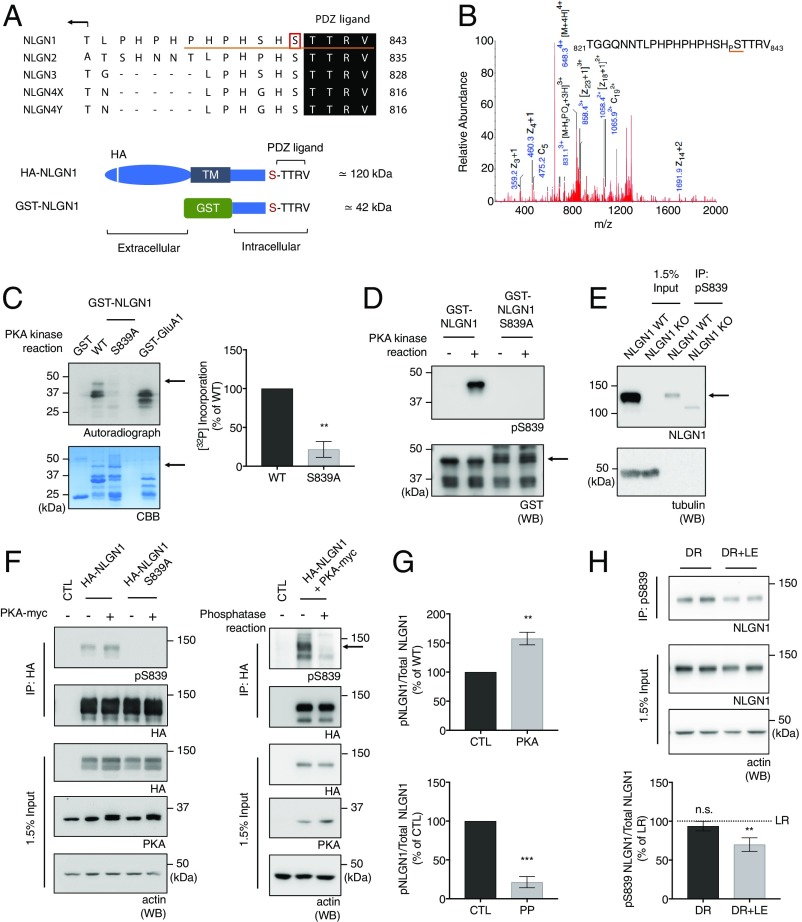
Fig. 2.
PKA phosphorylates NLGN1 on S839. (A) Sequence alignment for the C-tails of the NLGN isoforms. The pS839 antibody epitope is underlined in red. Schematic figures denote motifs within HA-NLGN1 and GST-NLGN1. (B) MS/MS spectrum of the phosphorylated NLGN1 peptide found in GST-NLGN1 fusion proteins incubated with ATP and purified PKA. Samples were digested with trypsin and analyzed using the LC/MS/MS method. (C) Autoradiography analysis of GST fusion proteins that were incubated with purified PKA and [γ-32P] ATP. Quantitative graph represents mean ± SEM (n = 3). **P = 0.0016 using an unpaired t test. (D) Immunoblot analysis of GST-NLGN1 WT and S839A fusion proteins that were phosphorylated in vitro with purified PKA and probed with pS839 antibody. Arrows in C and D denote GST-NLGN1 position in blots. (E) Endogenous phospho-S839 NLGN1 was enriched from WT mouse brain P2 lysates by immunoprecipitation using pS839 antibody with NLGN1 KO mouse brain as control. The immunoprecipitates were analyzed by immunoblotting; β-tubulin was used as a protein loading control for the input. (F) (Left) Immunoblot analysis of HA-NLGN1 WT and S839A transfected or cotransfected with constitutively active PKA in HEK293 cells. Arrows in E and F denote the NLGN1-specific band. (G) (Top) Quantitative graph represents mean ± SEM (n = 3). **P = 0.0017 using an unpaired t test. (F) (Right) PP assays were performed on the HA antibody immunoprecipitates from HEK293 cells expressing HA-NLGN1 WT and constitutively active PKA. The phosphatase assay samples were analyzed by immunoblotting. (G) (Bottom) Quantitative graph represents mean ± SEM (n = 3). ***P = 0.0004 using unpaired t test. (H) The primary visual cortex was macrodissected from a mouse dark-rearing paradigm as described in Materials and Methods. Endogenous phospho-S839 NLGN1 was enriched from P2 lysates by immunoprecipitation using pS839 antibody. Graph indicates mean ± SEM (n = 6). The statistical significance between the mean of LR and the mean of each condition was calculated using one-way ANOVA with Tukey’s multiple comparison test. **P = 0.0098 (LR vs. DR+LE). n.s., not significant.

