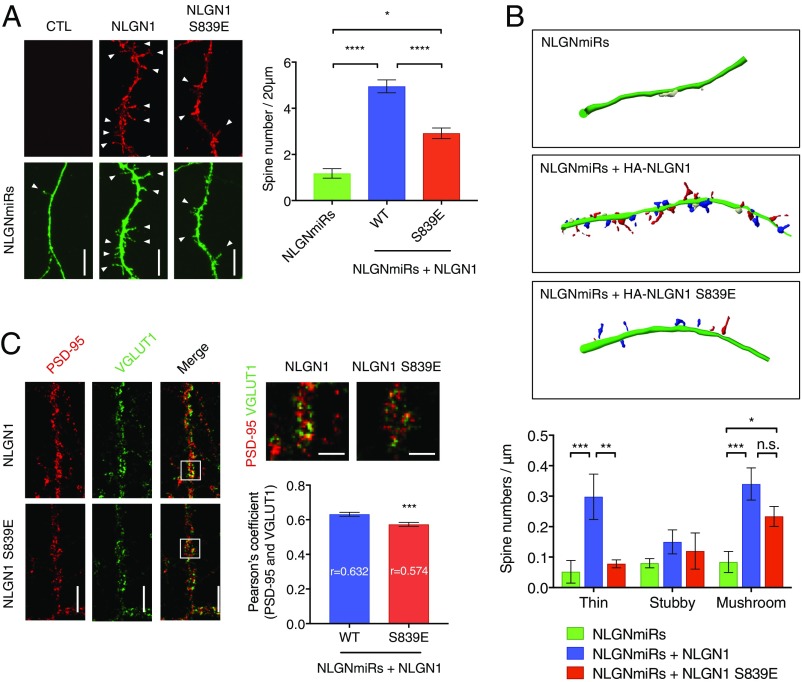
Fig. 5.
NLGN1 S839 phosphorylation reduces synaptic enhancement. (A) Cultured hippocampal neurons were transfected with NLGN miRs and HA-NLGN1 (WT or S839E) at DIV 5. After fixation and permeabilization, HA-NLGN1 was stained with anti-HA and Alexa 555-conjugated secondary antibody (red). Regions from secondary dendrites per each neuron were collected for spine number counting. Arrow heads indicate spines. (Scale bar, 5 µm.) Graph indicates mean ± SEM (n = 18). The statistical significance between every condition was calculated using one-way ANOVA with Tukey’s multiple comparison test. *P = 0.024866, and ****P < 0.000001. (B) Regions from secondary dendrites for each neuron were collected to categorize spine morphology using Neurolucida software. Thin (red), mushroom (blue), and stubby (white) spines are indicated. Graph indicates mean ± SEM (n = 6). The statistical significance between every condition was calculated using two-way ANOVA with Tukey’s multiple comparison test. **P = 0.0032 and ***P = 0.0010 for thin spines. *P = 0.0439 and ***P = 0.0006 for mushroom spines. n.s., not significant. (C) NLGN miRs and HA-NLGN1 (WT or S839E) were coexpressed in cultured hippocampal neurons at DIV 12. Endogenous PSD-95 were labeled with anti−PSD-95 and Alexa 555-conjugated secondary antibody (red), and endogenous VGLUT1 were labeled with anti-VGLUT1 and Alexa 647-conjugated secondary antibody (green). (Scale bar, 5 µm.) The selected regions in the merged image were enlarged. (Scale bar, 2.5 µm.) Regions from three dendrites per each neuron were analyzed for Pearson’s coefficient. Graph indicates mean ± SEM (n = 23). ***P = 0.0007 using unpaired t test.

