Fig. 6.
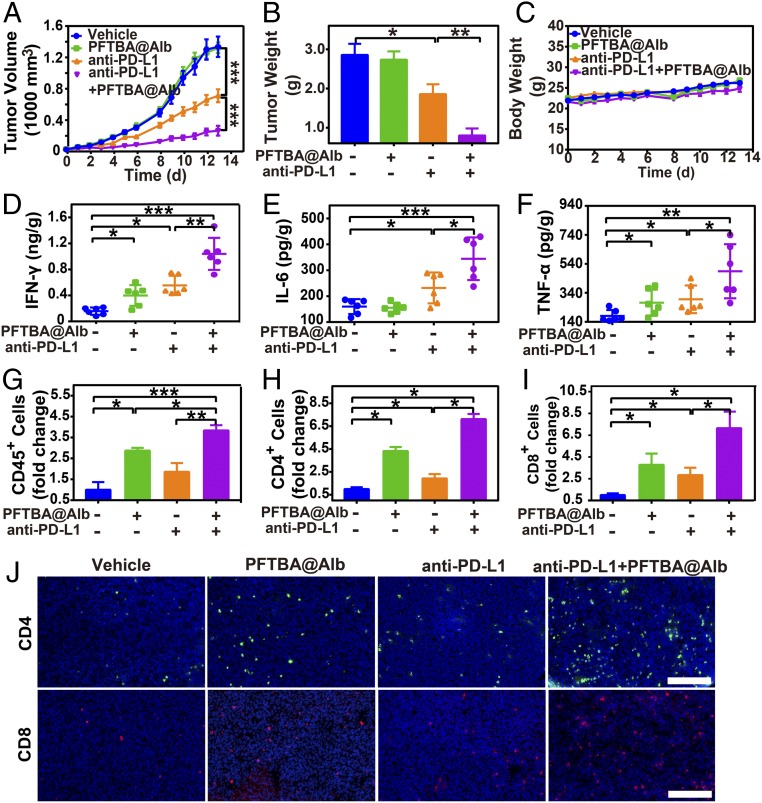
Effects of PFTBA@Alb on anti–PD-L1 antibody-mediated immunotherapy. (A) Tumor growth curves of CT26 tumor-bearing mice (n = 8). (B) Tumor weight at day 13 posttreatments (n = 8). (C) Body weight curves. (D–F) Protein levels of IFN-γ, IL-6, and TNF-α in CT26 tumor at day 13 posttreatments. (G–I) Fold change of the CD45+ lymphocytes, tumor-infiltrating CD4+ and CD8+ T cells in all the cells in CT26 tumors compared with the vehicle group (albumin, 3.2 g/kg). (J) Representative images of the immune fluorescence staining of the intratumor-infiltrating CD4+ T cells (green) and CD8+ T cells (red). (Scale bar: 100 μm.)

