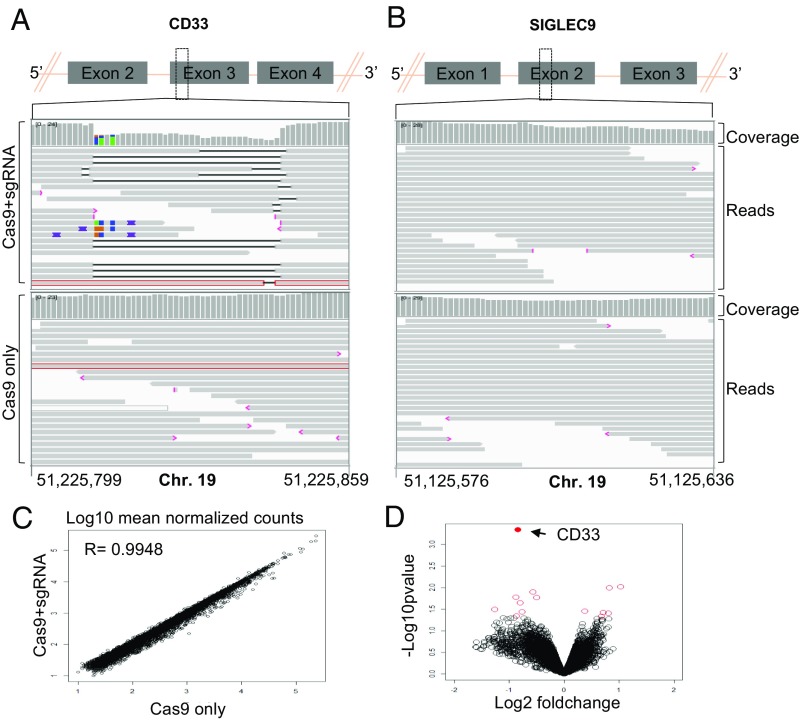
Fig. 3.
(A and B) IGV screenshot of genomic region of CD33 (A) and SIGLEC9 (B) genes surrounding the guides in Cas9+sgRNA (Top) and Cas9 only (Bottom) cells as indicated in the left. The gray bars in the coverage track (indicated on right) show the depth of the reads displayed at each locus. Generally, the coverage should be uniform and hence the bar height should be same but deletions results in dip in the height. The reads track shows all of the reads (gray boxes) mapped in this region. The deletions are represented by a solid black line and insertions with purple boxes. Reads with red border are those without a mapped mate. One read in each group was without a mapped mate. Mismatch bases are colored in green, blue, brown, and red for nucleotides A, C, G, and T, respectively. SIGLEC9 genomic region was selected as representative region to show absence of indels at off-target site because (i) it belongs to SIGLEC family with homology to CD33, and (ii) it has the highest homology within 10 bp of the expected cut site compared with any other guide (SI Appendix, Table S2). Chromosome coordinates at the bottom are based on hg38. (C) Scatter plot showing correlation between log10 mean normalized counts, normalized using the DEseq2 method, between CD33 edited cells and control cells. (D) Volcano plot showing log2 fold-change and −log10 P value for genes analyzed using the edgeR method; genes that were significantly differentially expressed (P < 0.05) are shown as red open circles and the CD33 gene is represented by a filled red circle and indicated by a left arrow (four donors).

