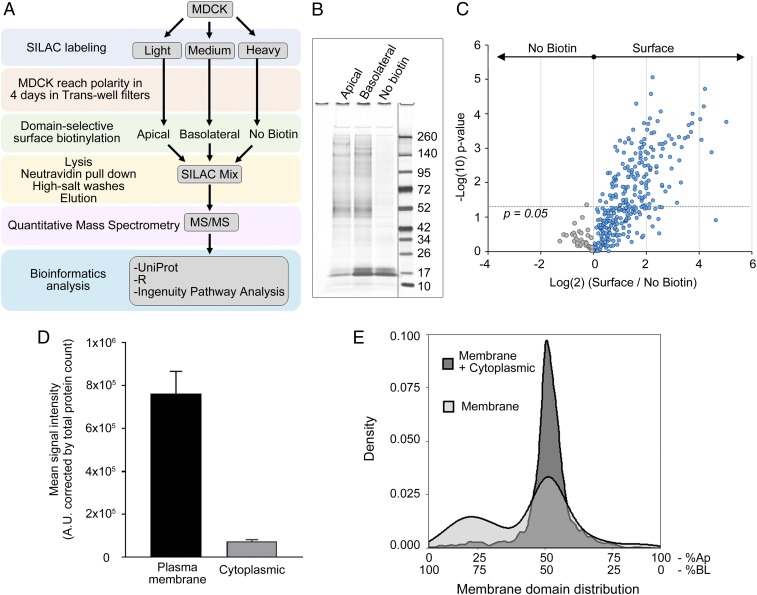
Fig. 1.
Polarized surface proteome in MDCK cells via surface biotinylation followed by SILAC. (A) Flow chart illustrating the procedure for obtaining a polarized surface proteome in MDCK cells. (B) Representative silver-stained gel showing apical and basolateral proteins retrieved after surface biotinylation and background from nonbiotinylated samples. Dividing line indicates noncontiguous gel lanes. (C) SILAC ratios of surface vs. nonbiotinylated proteins. Each data point represents a single protein. Gray datapoints represent proteins from the no biotin sample. Blue datapoints are proteins from the biotinylated sample. Dotted line indicates the −log(10) of a P value = 0.05. (D) Quantification of signal obtained from proteins annotated as plasma membrane or cytoplasmic proteins corrected by total number of proteins in each fraction. (E) Density plot showing percentage frequency of proteins annotated as plasma membrane and cytoplasmic (dark gray) and membrane proteins only (light gray) according to their polarized distribution at the apical and basolateral membrane domains. Ap, apical; BL, basolateral.

