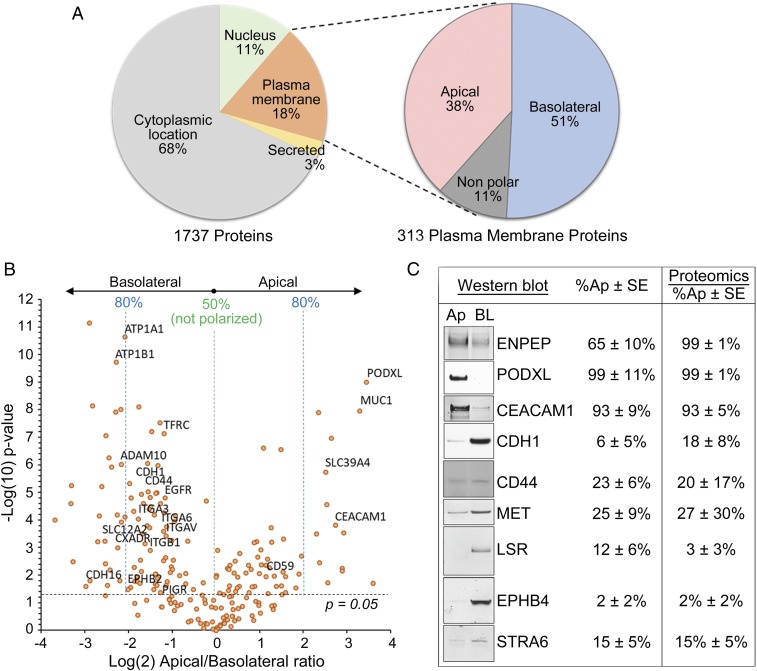
Fig. 2.
Apical and basolateral proteome of MDCK. (A) Subcellular localization of all 1,737 proteins identified by mass spectrometry (Left), of which 313 were plasma membrane proteins and were classified as apical, basolateral, or not polarized based on the SILAC ratios (Right). (B) Volcano plot of log(2) SILAC ratios for apical vs. basolateral proteins in MDCK cells (horizontal axis) against −log(10) P value (vertical axis). Each data point represents a single protein. Dotted line indicates the −log(10) of a P value = 0.05. Labels indicate proteins of previously known polarized distribution. (C) Validation of a subset of proteins via surface biotinylation followed by Western blot (Left) compared with the percentage detected at the apical and basolateral membranes in proteomics (Right). Ap, apical; BL, basolateral.

