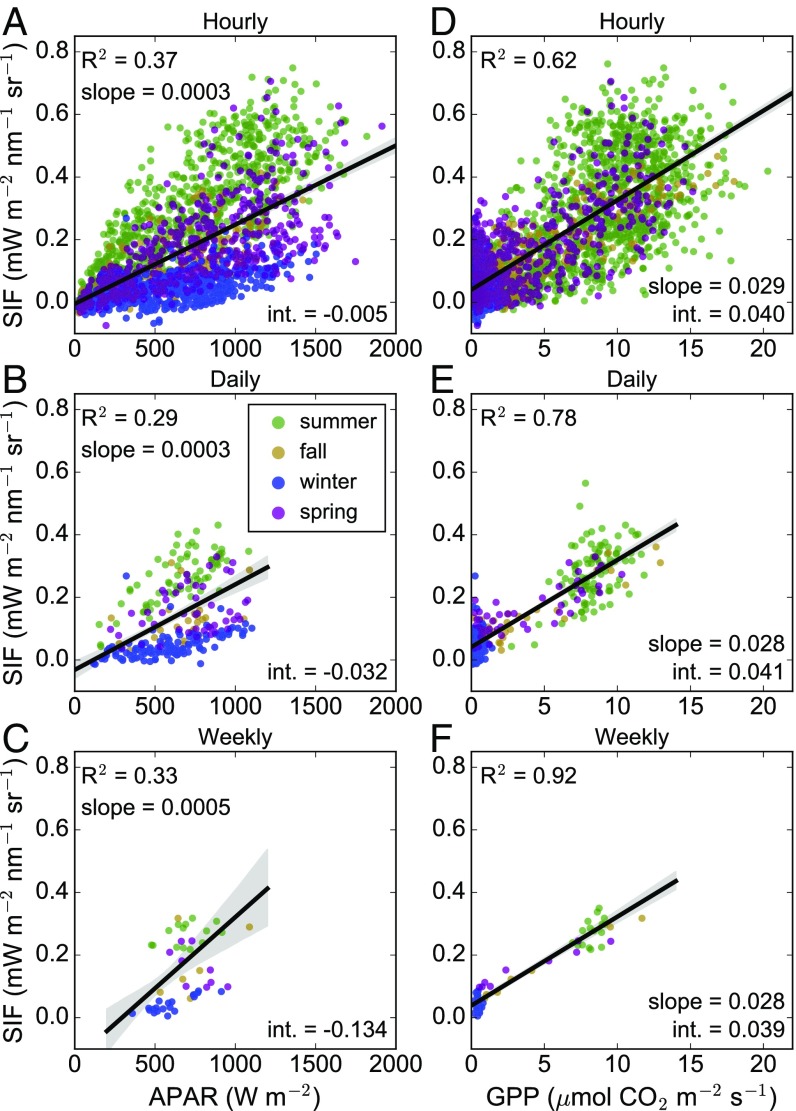
Fig. 3.
(A–F) Scatterplots of (A–C) far-red SIF against APAR and (D–F) GPP binned at hourly (A and D), daily (B and E), and weekly (C and F) time intervals. Points are colored by season, dictated by onset and suppression of photosynthesis. Shaded regions indicate a 95% confidence interval around the line of best fit. We report the coefficient of determination (R2), slope, and intercept of each line of best fit. All relationships are statistically significant at P < 0.05.

