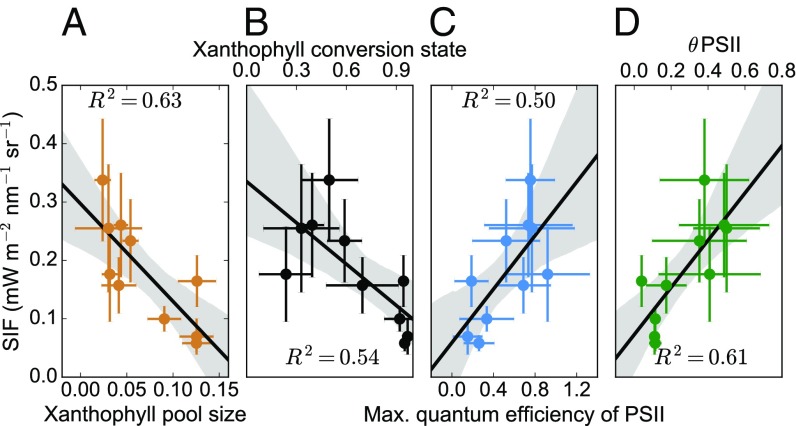
Fig. 4.
Correlation plots of weekly average far-red SIF against needle measurements of foliar pigment composition and PAM fluorescence. (A) Total xanthophyll cycle pigment pool (V+A+Z μmol·g−1). (B) Sustained retention of zeaxanthin and antheraxanthin after dark adaptation represented by the xanthophyll cycle conversion state ([Z+A]/[V+A+Z]). (C) Maximum quantum efficiency in the dark (Fv/Fm) measured by a fluorimeter. (D) Photosystem II operating efficiency (θPSII) at a photosynthetically active radiation (PAR) level of 500 μmol·m−2·s−1, derived during a light response curve. Shaded regions indicate a 95% confidence interval around the line of best fit. All relationships are statistically significant at P < 0.05.

