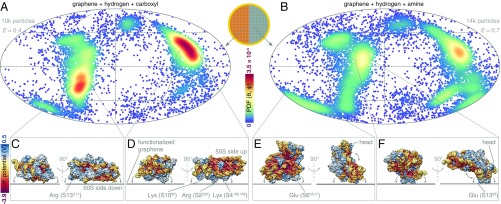
Fig. 3.
Mapping the surface interaction profile of the 30S ribosomal subunit on a multifunctional graphene grid. (A and B) The orientation distributions of 30S ribosomal subunits on two different graphene functionalizations from a single patterned grid are plotted on a Mollweide projection. Each point represents an observed particle and the color scale represents the calculated normalized probability density of observing a particle in a particular orientation. is the efficiency of each orientation distribution (14). The directions of the two most probable views and the variations around these are labeled. (C–F) The surface of the 30S ribosomal subunit is colored by Coulombic electrostatic potential. Insets show the particle orientation on the graphene sheet for each of the labeled views. The arrows show the rotations of the particle on the surface around this view. The in-plane rotation angle is chosen to show the directions with the largest and smallest spread for each view.

