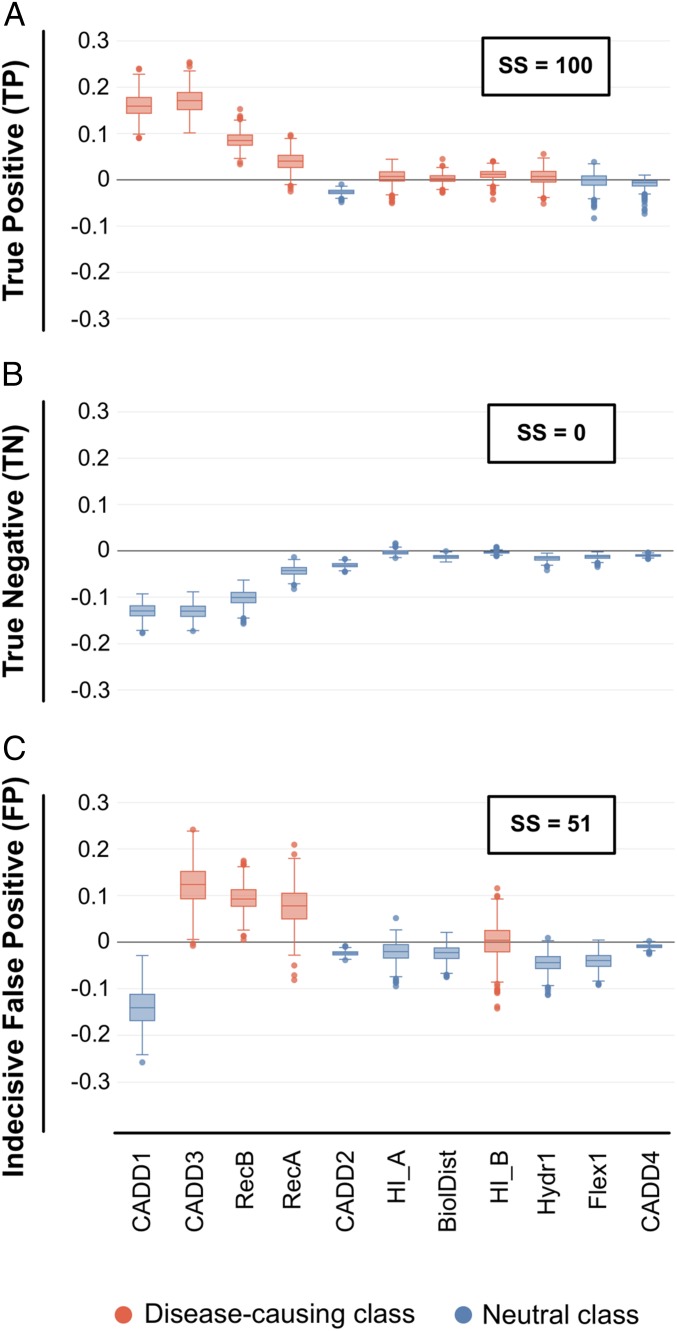
Fig. 6.
Decision profile (DP) boxplots that show the class preference (or decision) gradients of each feature used for the classification of test bilocus combinations. Features whose median decision gradient values, among all classifiers of the VarCoPP, fall above zero on the y axis are in favor of the disease-causing class (red color), whereas features whose median decision gradient values fall below zero on the y axis are in favor of the neutral class (blue color). (A) DP boxplot for a TP bilocus combination with SS = 100 (Dataset S1, testpos_21), where the vast majority of features have a median decision value above zero. (B) DP boxplot for a TN bilocus combination with SS = 0 (Dataset S3, testneg_769), where all features have a median decision value below zero agreeing for the neutral class. (C) Example of an indecisive DP boxplot for a neutral bilocus combination of the set of 1,000 test neutral combinations, which was predicted as disease-causing with SS = 51 (Dataset S3, testneg_358).

