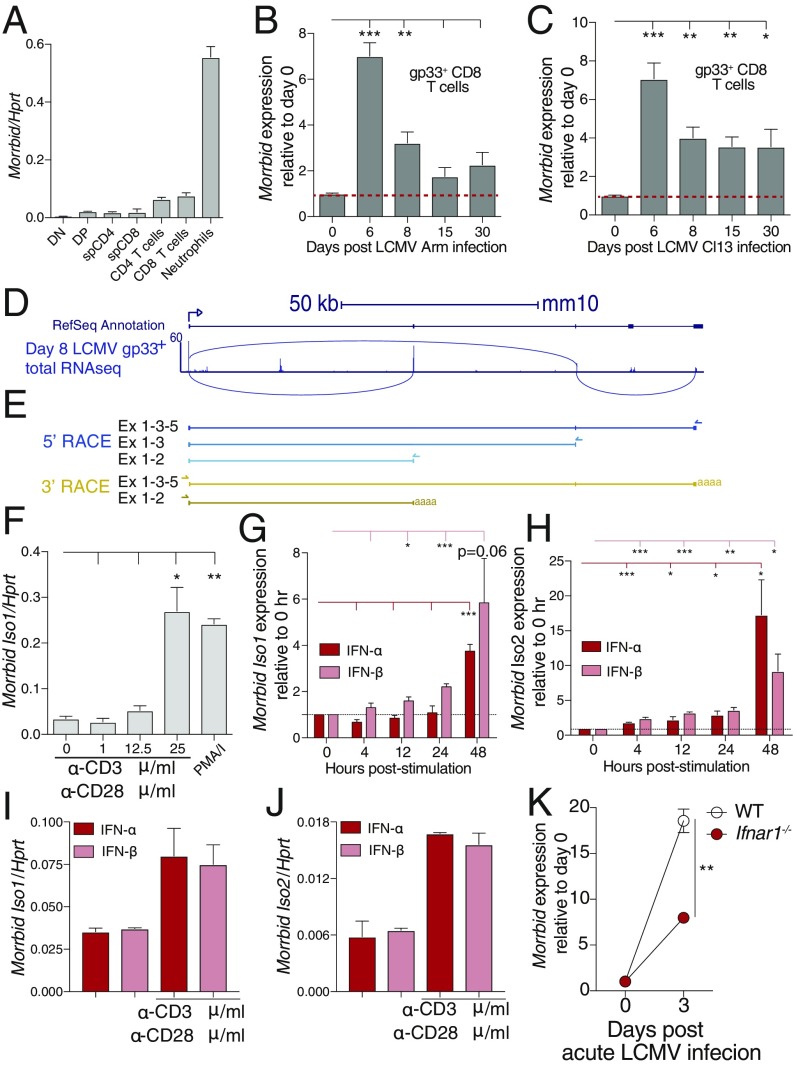
Fig. 1.
Morrbid is induced in CD8 T cells during viral infection and in response to TCR and type I IFN stimulation. (A) Morrbid transcript expression was assessed by qPCR in sorted double-negative (DN), double-positive (DP), single-positive (sp) CD4, and sp CD8 T-cell thymocytes, as well as splenic CD4 and CD8 T cells. Sorted neutrophils were used as positive control (n = 3 biological replicates; these data are representative of two independent experiments). (B and C) Morrbid expression in gp33-tetramer–specific CD8 T cells by microarray after (B) LCMV Armstrong (Arm) and (C) LCMV clone 13 (Cl13) infection represented relative to uninfected (GSE41867; n = 3–4 biological replicates). (D, Top) Schematic of the Morrbid locus and its predicted exons. (D, Bottom) Day 8 post-LCMV P14 CD8 T-cell total RNAseq reads that map to the Morrbid locus (GSE88987). Lines indicate reads spanning two locations. (E, Top) 5′- and (Bottom) 3′-rapid amplification of cDNA ends (RACE) of the Morrbid locus from CD8 T cells stimulated with αCD3/αCD28/IFN-β. The arrows indicate gene-specific primers. (F) qPCR of Morrbid transcript expression in sorted splenic CD8 T cells from naive WT spleens stimulated with the indicated doses of plate-bound αCD3 and 1 μg/mL soluble αCD28, or PMA/I for 4 h (n = 3 biological replicates). (G and H) qPCR of (G) Morrbid isoform 1 and (H) isoform 2 in negatively selected splenic CD8 T cells stimulated for indicated time with 1 μg/mL plate-bound αCD3, 1 μg/mL soluble αCD28, and 20 ng/mL IFN-α or IFN-β. Expression is represented as fold change relative to 0 h (n = 3 biological replicates; these data are representative of three independent experiments). (I and J) qPCR of (I) Morrbid isoform 1 and (J) isoform 2 transcript in negatively selected splenic CD8 T cells unstimulated or stimulated for 48 h with IFN-α or IFN-β (n = 3 biological replicates; these data are representative of three independent experiments). (K) Morrbid expression in WT or Ifnar1−/− P14 CD8 T cells by microarray after acute LCMV infection represented relative to uninfected (GSE57355; n = 3 biological replicates). Error bars show SEM. *P < 0.05, **P < 0.01, and ***P < 0.001 (unpaired two-sided t test, B, C, F–H, and K).

