Fig. 1.
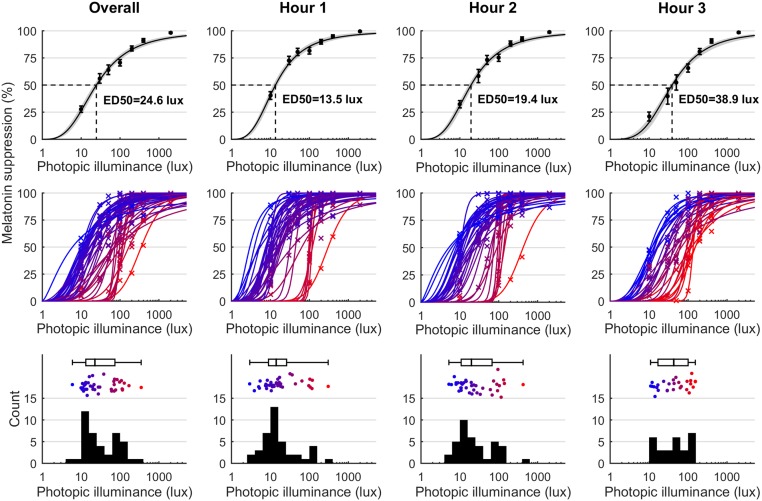
Melatonin suppression depends on light intensity and time of exposure and exhibits large interindividual differences. Columns correspond to overall data (i.e., all data after DLMO) and hours 1–3 after DLMO. Top shows group-level dose–response curves to light. ED50 values are indicated. Error bars represent mean ± SEM. Gray shaded areas in the top row represent 95% CIs for the fitted logistic curve. Middle shows individual-level dose–response curves. Individual curves (solid lines) and corresponding data points (crosses) are colored from blue (lowest ED50) to red (highest ED50). Individual-level curves are shown only for individuals with a reliable ED50 value (95% CI <1 log-unit). Bottom shows histograms of the individual ED50 values, with accompanying box plot and individual data points colored from blue (lowest ED50) to red (highest ED50).

