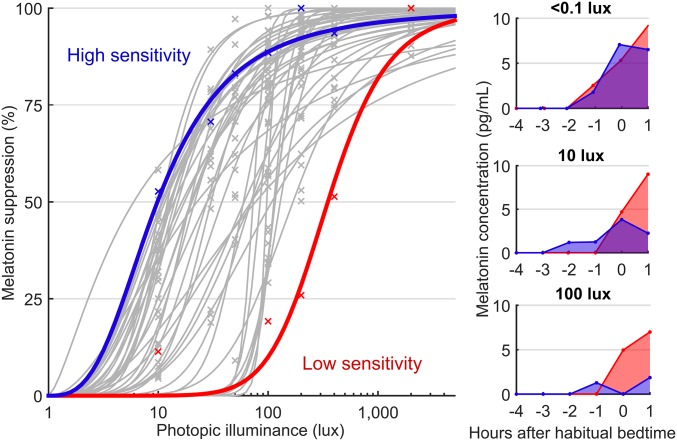
Fig. 2.
Comparison of two individuals with high and low light sensitivity. (Left) Highlights two individual dose–response curves: an individual with high sensitivity (blue) and an individual with low sensitivity (red) and includes individual-level curves for all other participants (gray). Individual data points are shown (crosses). Right show the two individuals’ respective melatonin concentrations across time under the <1-lux (dim control; Top), 10-lux (Middle), and 100-lux (Bottom) conditions, where their differences in responsiveness manifest. The x-axis values are hours relative to habitual bedtime (0).

