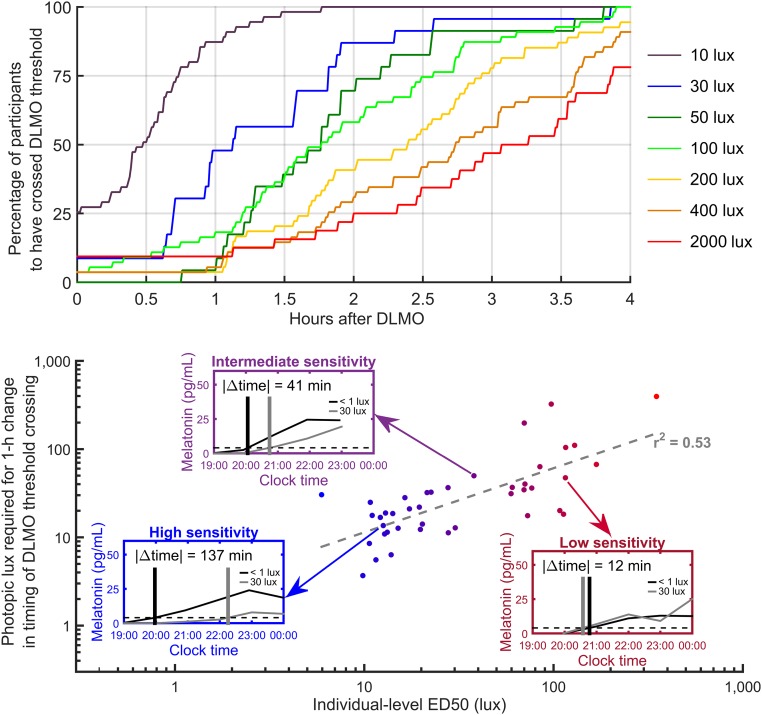
Fig. 3.
The time at which an individual crosses the DLMO threshold has a dose–response relationship with light intensity. Upper shows the percentage of participants who had crossed the 4-pg/mL (DLMO) threshold at a given time after baseline DLMO. Colored curves correspond to different light intensities. Lower shows the relationship between individual-level ED50 values and the estimated level of light required to move the apparent melatonin onset 1 h later than baseline DLMO. The gray dashed line shows a linear regression to the log–log values. Lower, Insets represent three individuals: high sensitivity (blue Inset), intermediate sensitivity (purple Inset), and low sensitivity (red Inset). In each Inset, melatonin concentration is plotted with respect to clock time for baseline (black curve) and at 30 lux (gray curve). Horizontal dashed lines indicate the 4-pg/mL threshold. Vertical lines indicate times at which melatonin concentration crossed the 4-pg/mL threshold. Included are all participants with an accurate ED50 estimate (95% CI < 1 log10-unit).

