
Figure 4.
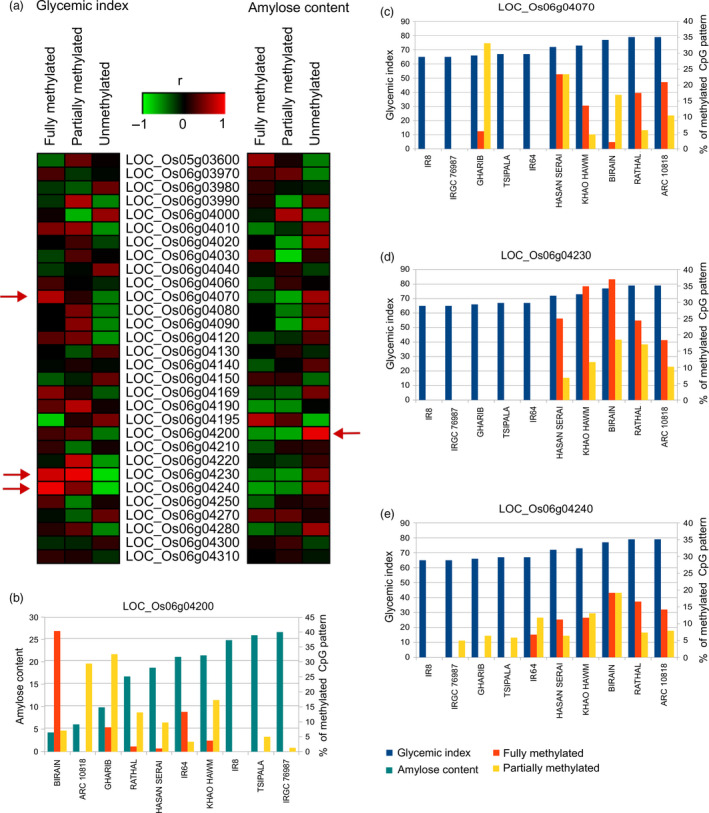
Presence of CpG methylation and their correlation with the GI and amylose content (AC) observed in ten resequenced germplasm lines. (a) Representation of the correlations between degree of CpG methylation present in the promoter region of genes underlying GI6.1 hotspot region with the GI and AC; evaluated in three main categories, fully‐unmethylated, partially (10%–90% methylation) and fully methylated (>90% methylated region) categories. Correlation coefficients ranged from −1 (green) to +1 (red). Horizontal red arrow depicts the candidates showing the significant correlations with the respective trait. (b) Graphs showing the degree of the CpG methylation (fully and partially methylation) patterns in the genic region of the key candidates LOC_Os06g04200 linked with AC, (c) LOC_Os06g04070, (d) LOC_Os06g04230 and (e) LOC_Os06g04240, linked with and GI values (c–e).