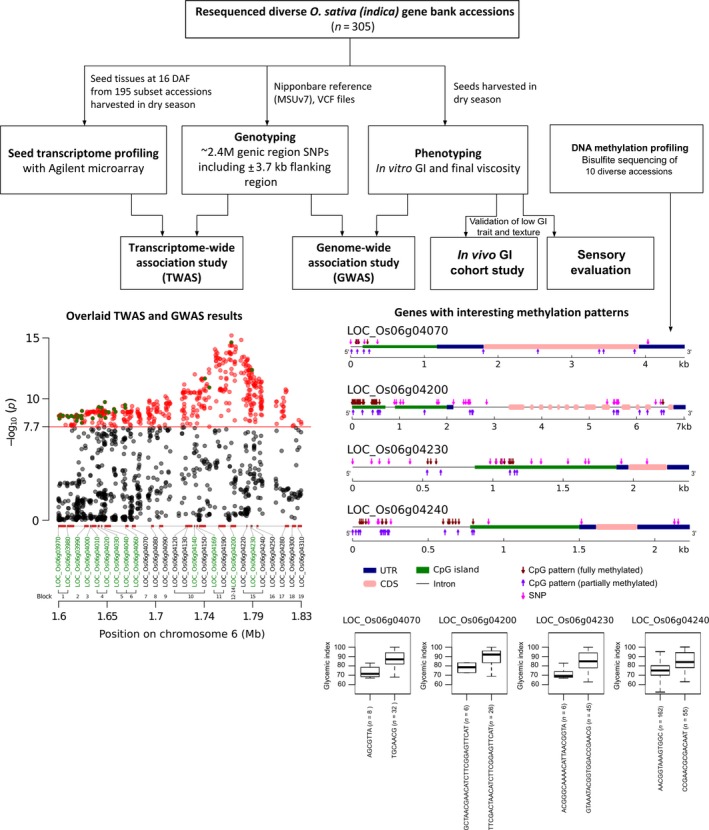
Figure 6.

Schematic overview summarizing the predicted regions influencing rice glycaemic index and texture. Overlaying genome‐wide association study with transcriptome‐wide association study results (shown at the bottom left) narrowed the candidate genes down to 13 in the GI6.1 region, and further validated using expression QTL (eQTL) analysis. Four important loci influencing GI trait within GI6.1 region show interesting methylation patterns. The diagnostic haplotypes identified in LOC_Os06g04070, LOC_Os06g04200, LOC_Os06g04230 and LOC_Os06g04240 are critical to lowering the glycaemic index.
